
Documentation › Charts
Building a chart
Build a chart in Embiro BI's chart editor - choose a dataset and type, add metrics, group by columns, filter, customize and save.
Charts are built in the chart editor, also called Explore. You pick a dataset and a chart type, say what to measure and how to group it, then style it.
Who can do this: Super Admin, Admin and Analysts. Business Users can open a chart from a dashboard and change its filters, but can't save it.
Start a chart
Any of these opens the editor:
- Charts → + Chart: choose a dataset, then a chart type, then Create new chart;
- Datasets → click a dataset's name: opens the editor with that dataset as a table;
- Home → Create a chart;
- SQL Lab → run a query → Create chart.
The editor at a glance
The editor has three columns:
- Dataset panel (left): the dataset's metrics and columns. Drag them into the controls, or search with the box at the top. ⋮ next to the dataset name lets you edit the dataset or switch to another one.
- Controls (middle), in two tabs:
- Data: what the chart shows (metrics, dimensions, filters, time range, row limit);
- Customize: how it looks (titles, legend, labels, colours, number formats).
- Chart (right): the result. Below it, Results and Samples show the data as a table, and ⋯ → View query shows the SQL that ran.
When you change a control, click Update chart to run the query again.
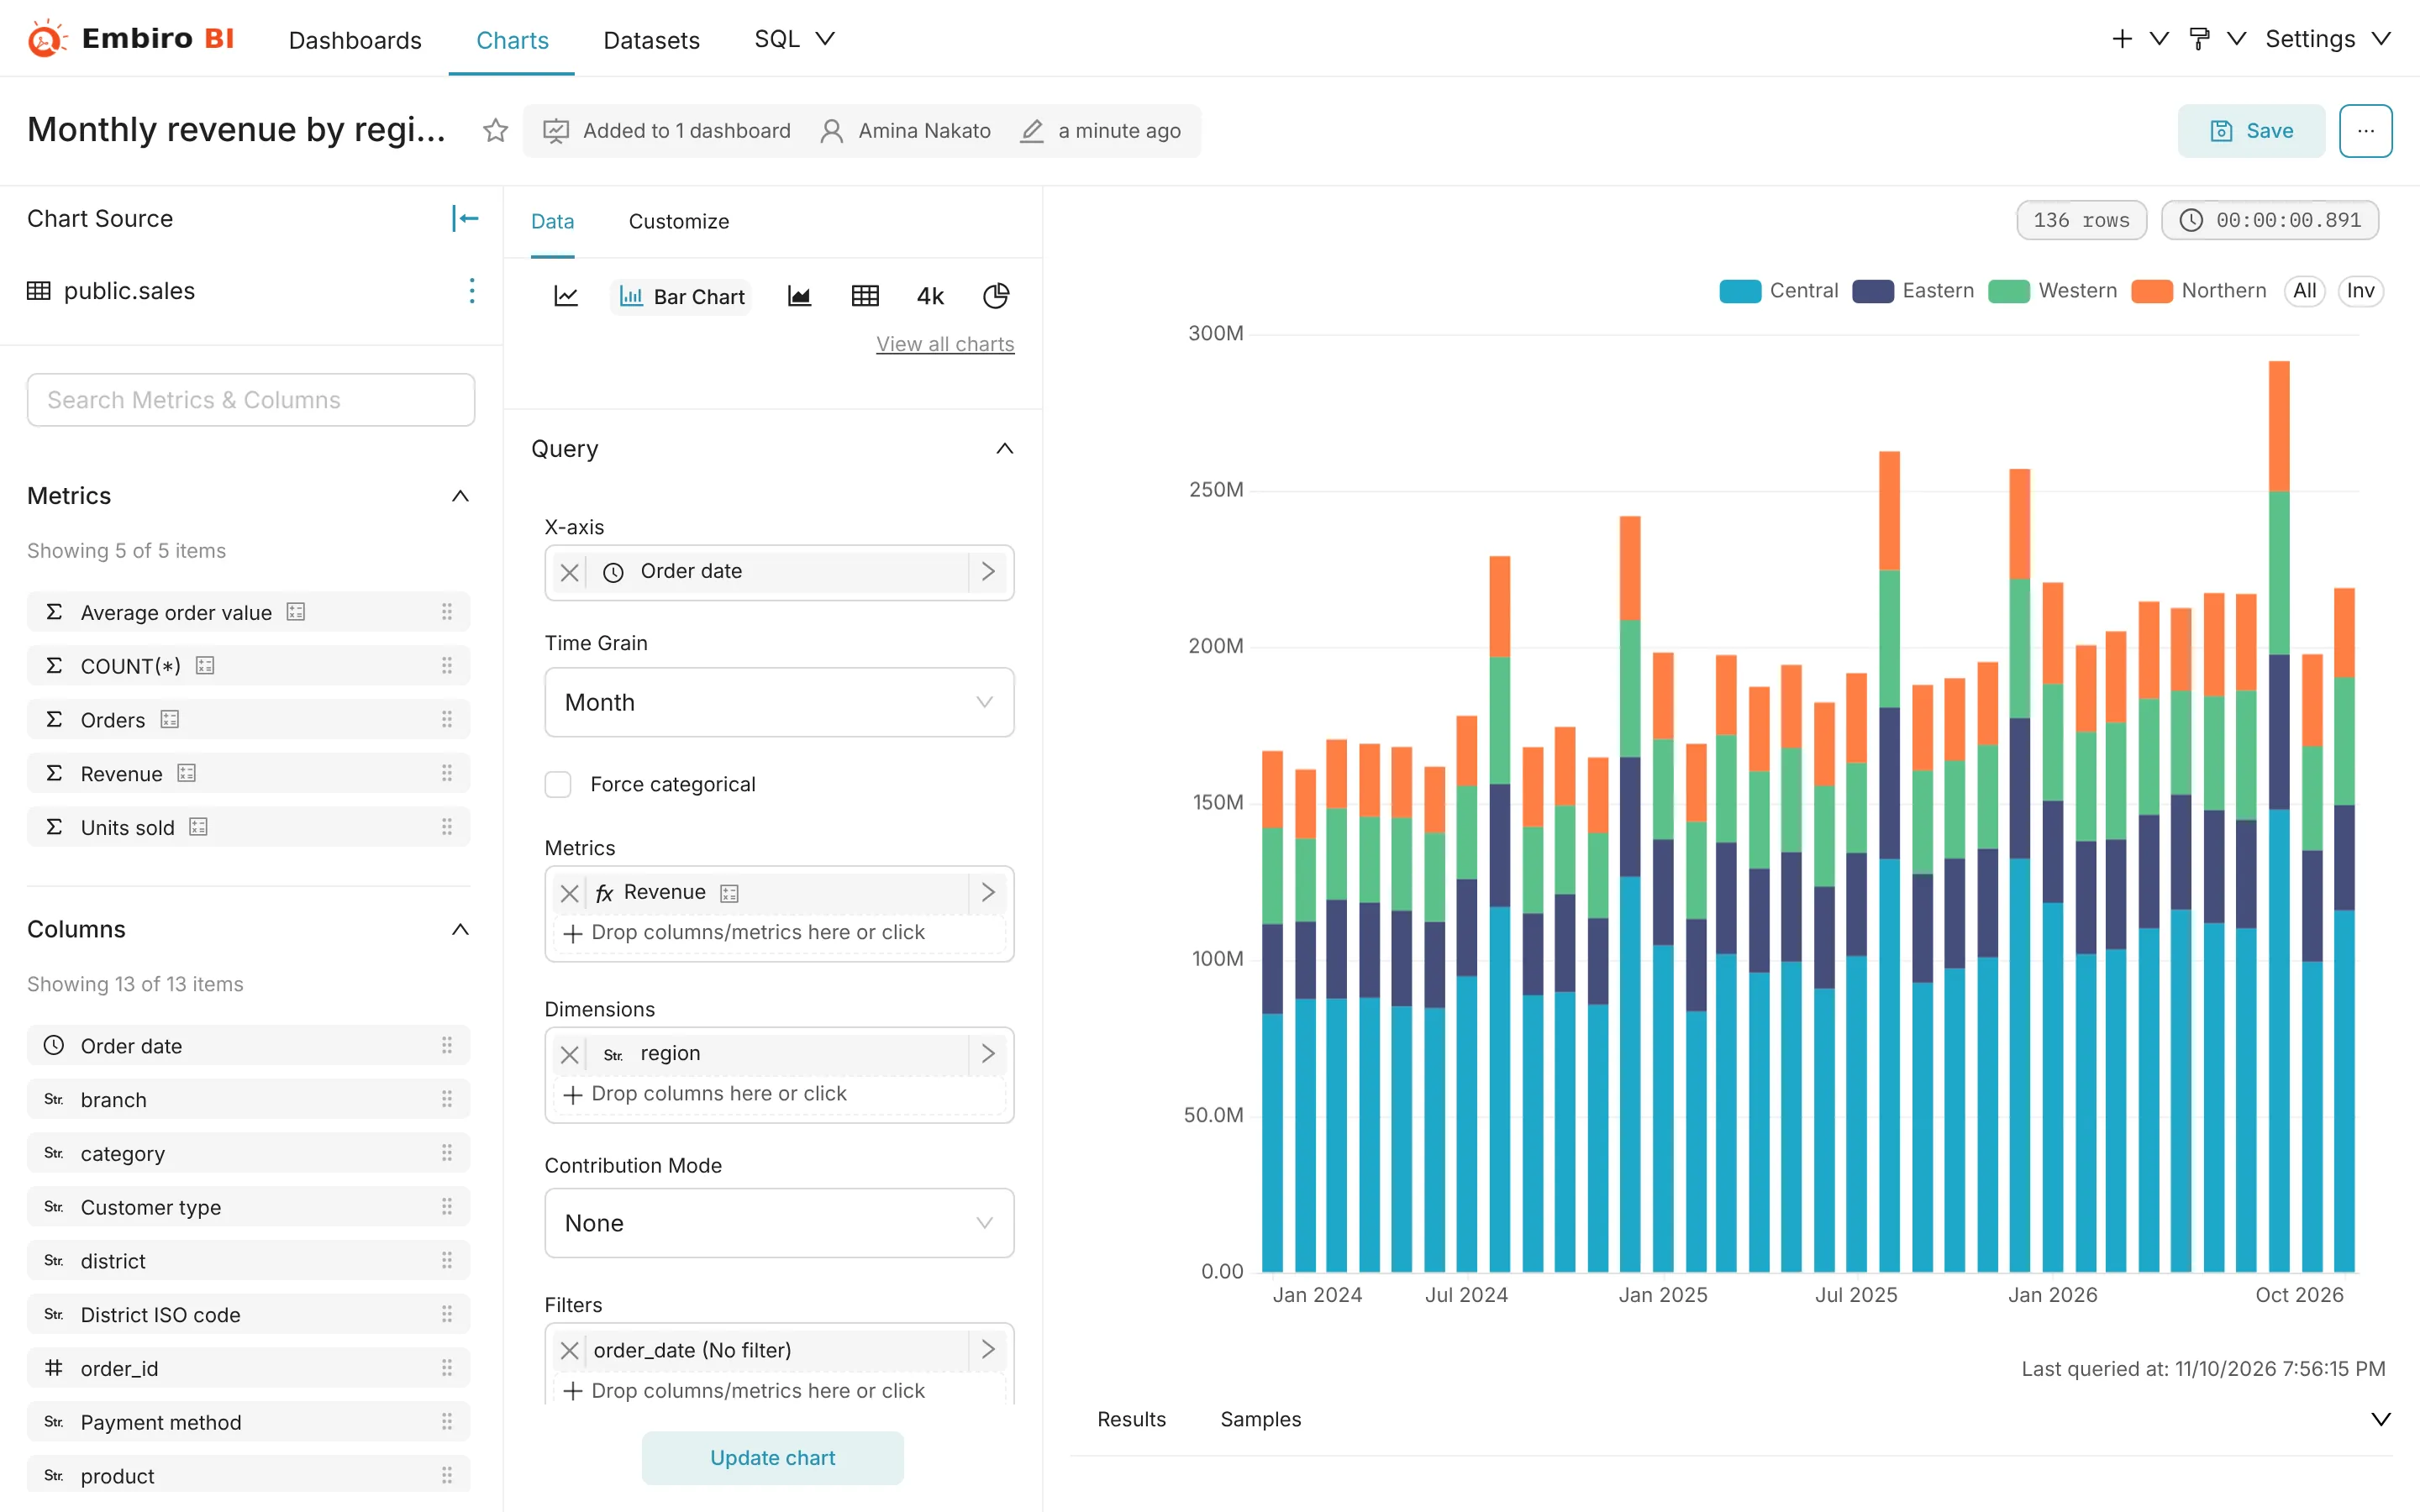
The main controls
- Metrics
-
What you measure: a saved metric such as Revenue, or an ad-hoc one. Click +, then:
- Saved: pick a metric defined on the dataset;
- Simple: pick a column and an aggregate (
SUM,AVG,COUNT,COUNT_DISTINCT,MIN,MAX); - Custom SQL: type an expression such as
SUM(revenue_ugx) / COUNT(DISTINCT order_id).
Click the metric's name in its box to rename it for this chart.
- Dimensions / X-axis / Group by
- How rows are grouped: a bar per region, a line per product category, a row per branch. Time-series charts take a date column on the X-axis and a Time grain (day, week, month, quarter, year).
- Filters
- Which rows to include, for example
region = Centralorrevenue_ugx > 0. Click +, choose a column, an operator and a value, or use Custom SQL for aWHEREclause. - Time range
- The period to include, such as Last quarter or 2025-01-01 ≤ col < 2026-01-01. See Time ranges and filters.
- Row limit / Series limit
- The most rows (or series) to show, with Sort by to keep the top ones. Use this for "top 10 products".
- Advanced analytics
- Rolling averages, cumulative sums, period-over-period comparisons (Time comparison: 1 year ago and so on) and resampling, on time-series charts.
Customize
The Customize tab depends on the chart type. Commonly used:
- Chart title, X Axis Title, Y Axis Title;
- Show legend, Show value (labels on bars), Sort bars;
- Color scheme: colours stay the same for the same value across a dashboard;
- Y Axis Format / Number format:
,dfor 1,234,567,.3sfor 1.23M. See Number and date formatting; - Currency format: show amounts as
UGX 1,234,567.
Save a chart
- Click Save (top right).
- Name the chart. Choose Save (Overwrite) to update this chart or Save as... to keep the original and create a copy.
- Optionally choose a dashboard under Add to dashboard, or type a new dashboard name to create one.
- Click Save, or Save & go to dashboard.
Share and export a chart
From ⋯ (top right of the editor) or a chart's menu on a dashboard:
- Share → Copy permalink to clipboard (keeps the current controls), Embed code, or Share chart by email;
- Download → Export to .CSV, Export to Excel, Export to .JSON, Download as image;
- View query and View as table.
Business Users see download options only if your organization allows it. See Export controls.
Properties, owners and tags
⋯ → Edit chart properties sets the chart's name, description, Certified by, Cache timeout, Owners and Tags. Owners can always edit the chart. Analysts and admins can edit any chart in the organization.
Something unclear or missing? Tell us and we'll improve this page.