
Documentation › Datasets
Metrics and calculated columns
Define reusable metrics such as revenue or average order value, and calculated columns such as month or profit, on a dataset.
Metrics and calculated columns let you define a business calculation once, on the dataset, and reuse it in every chart. Both are written as SQL expressions in your database's own SQL dialect.
Metrics
A metric is an aggregate: it turns many rows into one number per group.
- Edit the dataset (Datasets → pencil icon) and open Metrics.
- Click + Add item.
- Fill in:
- Metric key: a short name without spaces, such as
revenue; - Label: what charts show, such as Revenue (UGX);
- SQL expression: the calculation, such as
SUM(revenue_ugx); - optionally a D3 format such as
,.0fand a Description.
- Metric key: a short name without spaces, such as
- Click Save.
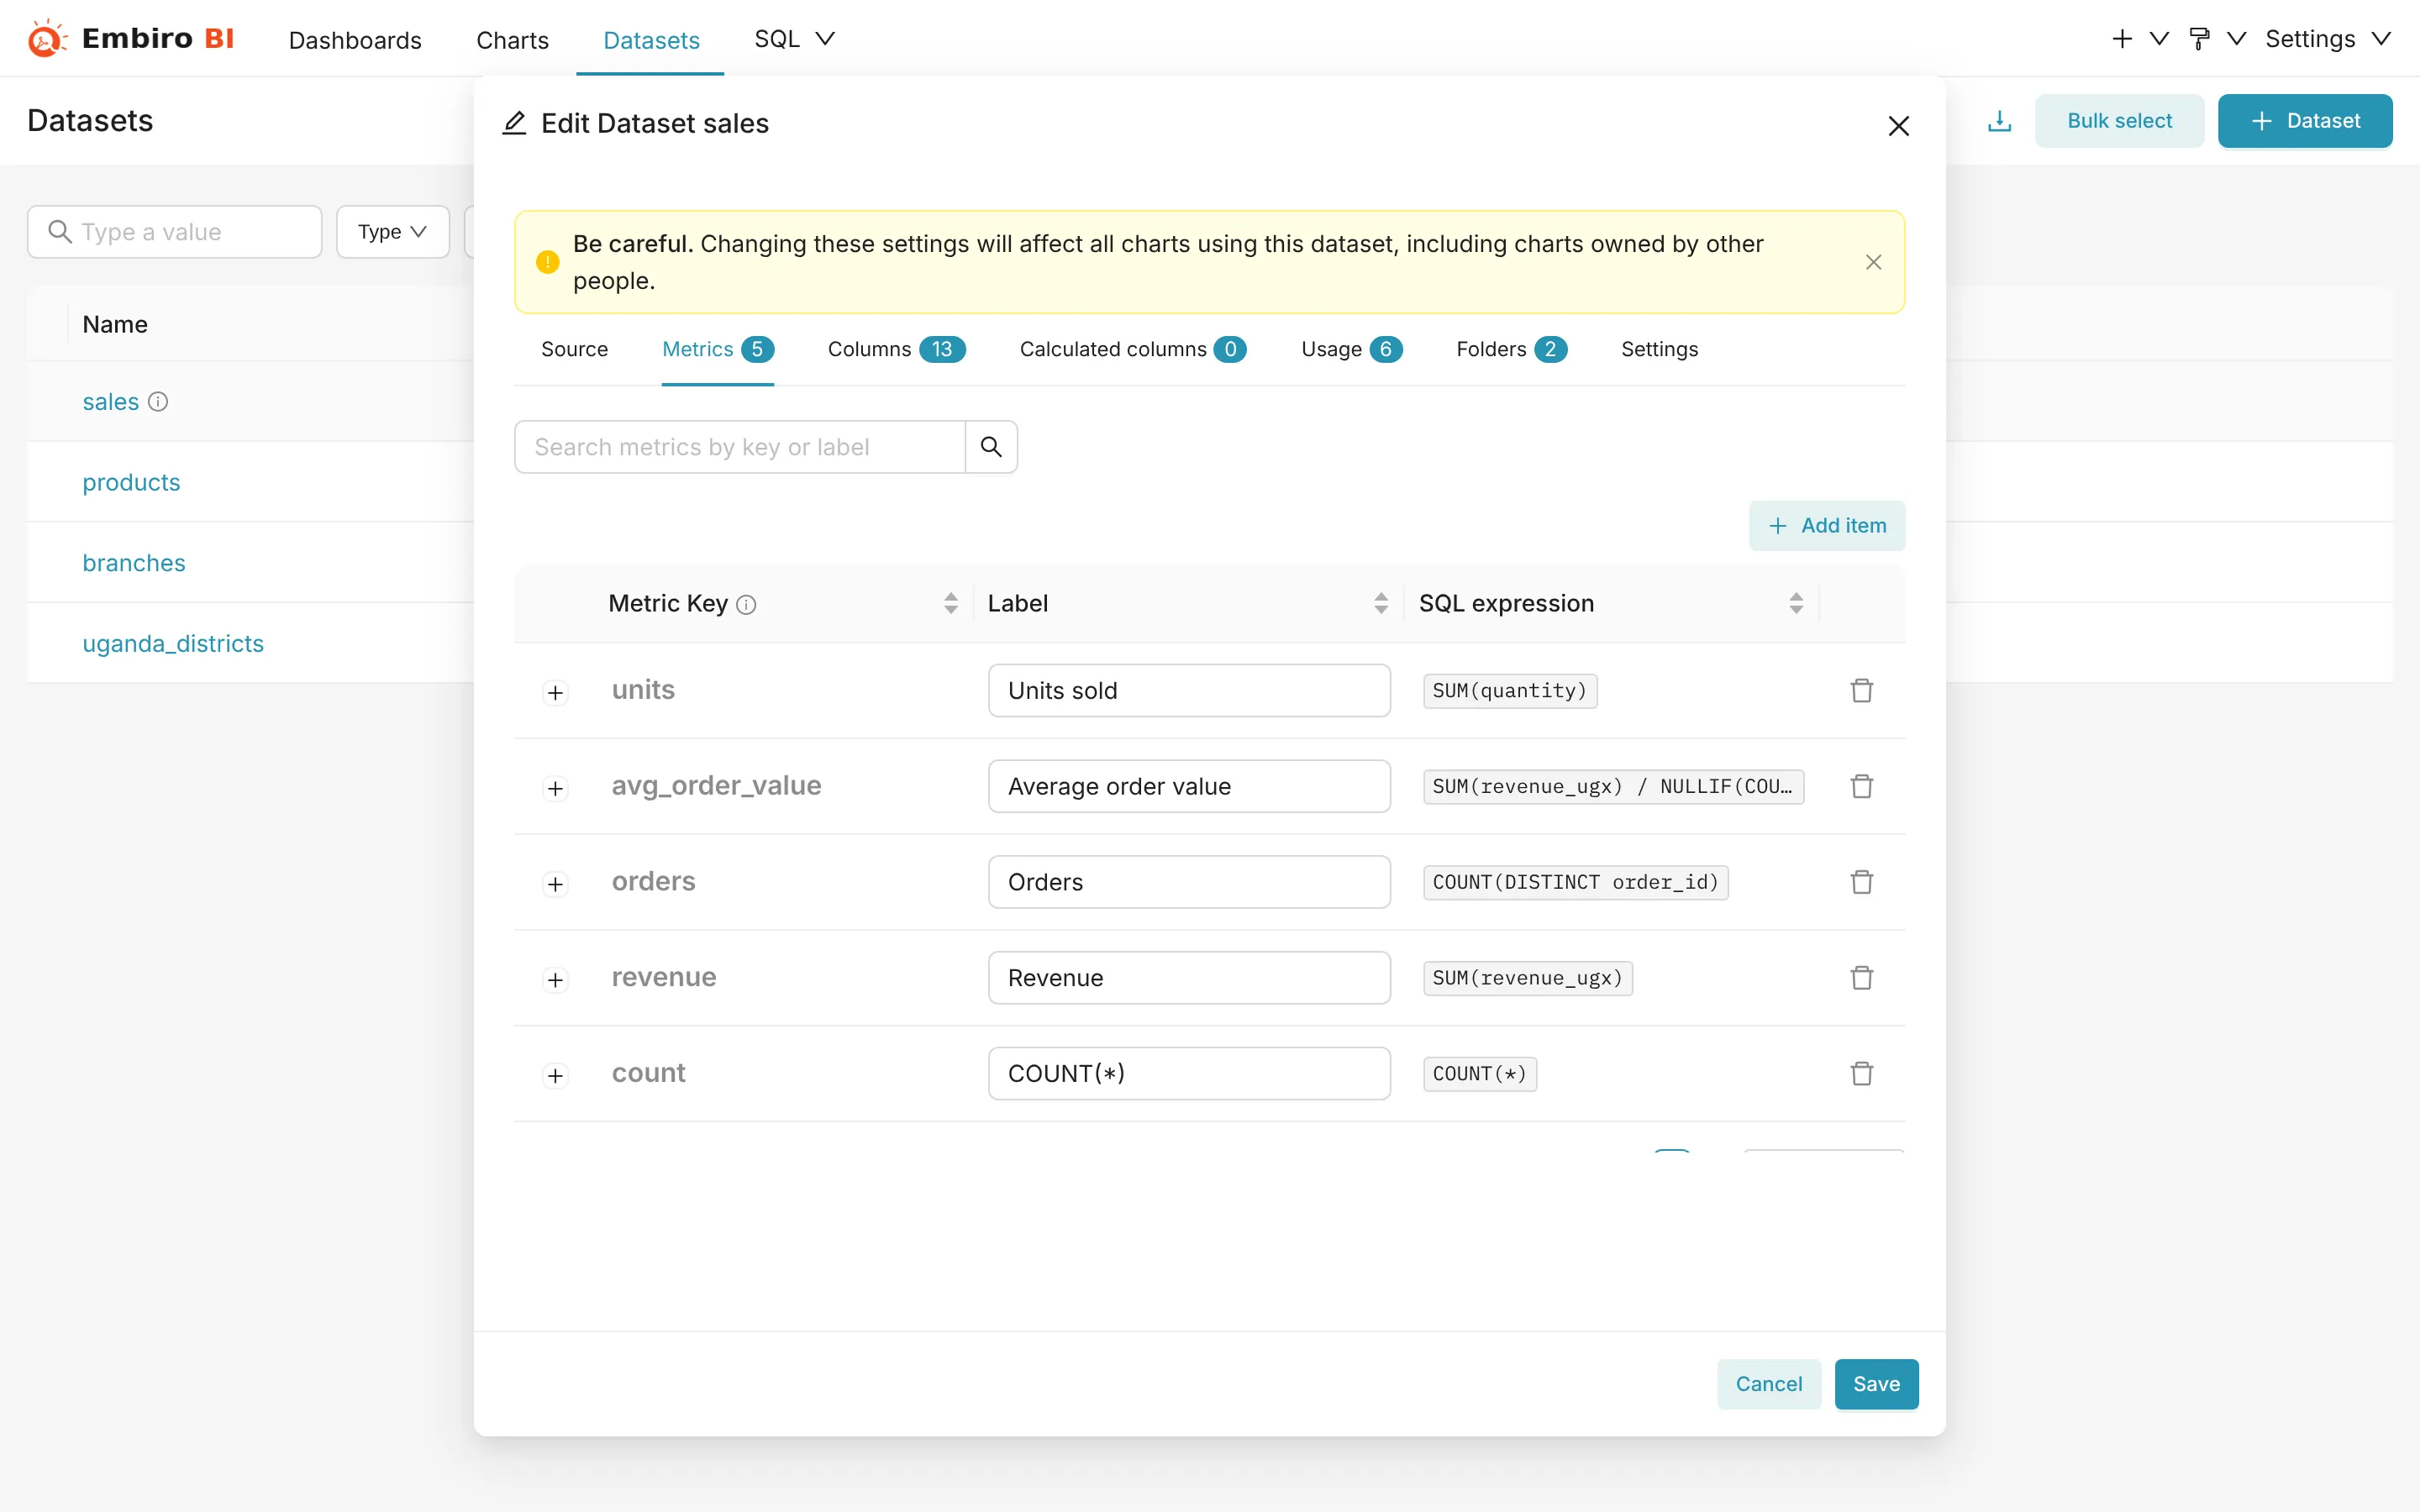
Useful metric expressions (PostgreSQL):
| Metric | SQL expression |
|---|---|
| Revenue | SUM(revenue_ugx) |
| Orders | COUNT(DISTINCT order_id) |
| Average order value | SUM(revenue_ugx) / NULLIF(COUNT(DISTINCT order_id), 0) |
| Gross margin % | 100.0 * SUM(revenue_ugx - cost_ugx) / NULLIF(SUM(revenue_ugx), 0) |
| Customers | COUNT(DISTINCT customer_id) |
| Revenue from mobile money | SUM(CASE WHEN payment_method = 'Mobile Money' THEN revenue_ugx ELSE 0 END) |
Use NULLIF(..., 0) in divisions so a group with nothing in it shows empty instead of an error.
Ad-hoc metrics
You don't have to save every metric on the dataset. In the chart editor, Metrics → + lets you pick a column and an aggregate (Simple) or type an expression (Custom SQL) for that chart only. Save a metric on the dataset once two charts need it.
Calculated columns
A calculated column works on each row. Use it like an ordinary column: to group by, filter on, or put on the X-axis.
- Edit the dataset and open Calculated columns.
- Click + Add item.
- Give it a Column name, such as
profit_ugx, and the SQL expression, such asrevenue_ugx - cost_ugx. - Tick Is temporal if it is a date, Is filterable and Is dimension as needed.
- Click Save.
Examples (PostgreSQL):
| Column | SQL expression |
|---|---|
profit_ugx |
revenue_ugx - cost_ugx |
order_month (temporal) |
DATE_TRUNC('month', order_date) |
size_band |
CASE WHEN revenue_ugx >= 1000000 THEN 'Large' WHEN revenue_ugx >= 200000 THEN 'Medium' ELSE 'Small' END |
full_name |
first_name \|\| ' ' \|\| last_name |
order_date from text (temporal) |
TO_DATE(order_date_text, 'DD/MM/YYYY') |
For MySQL use its functions instead, such as DATE_FORMAT(order_date, '%Y-%m-01') or CONCAT(first_name, ' ', last_name). For Google Sheets and Jotform datasets, expressions use SQLite functions, such as CAST(amount AS REAL) or strftime('%Y-%m', created_at).
Metrics from dbt
If your organization uses dbt, metrics defined in your dbt project can be synced onto the matching datasets automatically. See dbt integration.
Something unclear or missing? Tell us and we'll improve this page.