
Documentation › Dashboards
Building a dashboard
Create a dashboard, add and arrange charts, use tabs, headers and text, and publish it for your team.
A dashboard puts charts, text and filters on one page. Viewers can filter it, open any chart in full, and download data if allowed.
Who can do this: Super Admin, Admin and Analysts.
Create a dashboard
- Dashboards → + Dashboard, or Home → Build a dashboard; or
- while saving a chart, type a new dashboard name under Add to dashboard.
A new dashboard opens in edit mode. Click the title to rename it.
Add charts
In edit mode, the right panel has two tabs:
- Charts
- Every chart you can use. Search by name, then drag a chart onto the grid. Create new chart opens the chart editor in a new tab.
- Layout elements
- Tabs, Row, Column, Header, Text (Markdown), and Divider. Drag them onto the grid like charts.
Resize a chart by dragging its right or bottom edge. Drag a chart by its top edge to move it. The grid is 12 columns wide: three charts side by side take 4 columns each.
Tabs, headers and text
- Tabs split a long dashboard into pages, such as Overview, Branches and Products. Each tab loads its charts only when opened, which keeps the dashboard fast.
- Header adds a section title.
- Text holds Markdown: explanations, definitions, links or a logo. For example:
### How to read this dashboard
Revenue is **net of VAT**, in Uganda shillings. Data refreshes every hour.
Questions? Contact the finance team at [finance@example.co.ug](mailto:finance@example.co.ug).
Save and publish
- Click Save to leave edit mode.
- New dashboards are Draft: only owners, Analysts and admins see them in lists. Click Draft next to the title to make it Published, so Business Users with access to its data see it too.
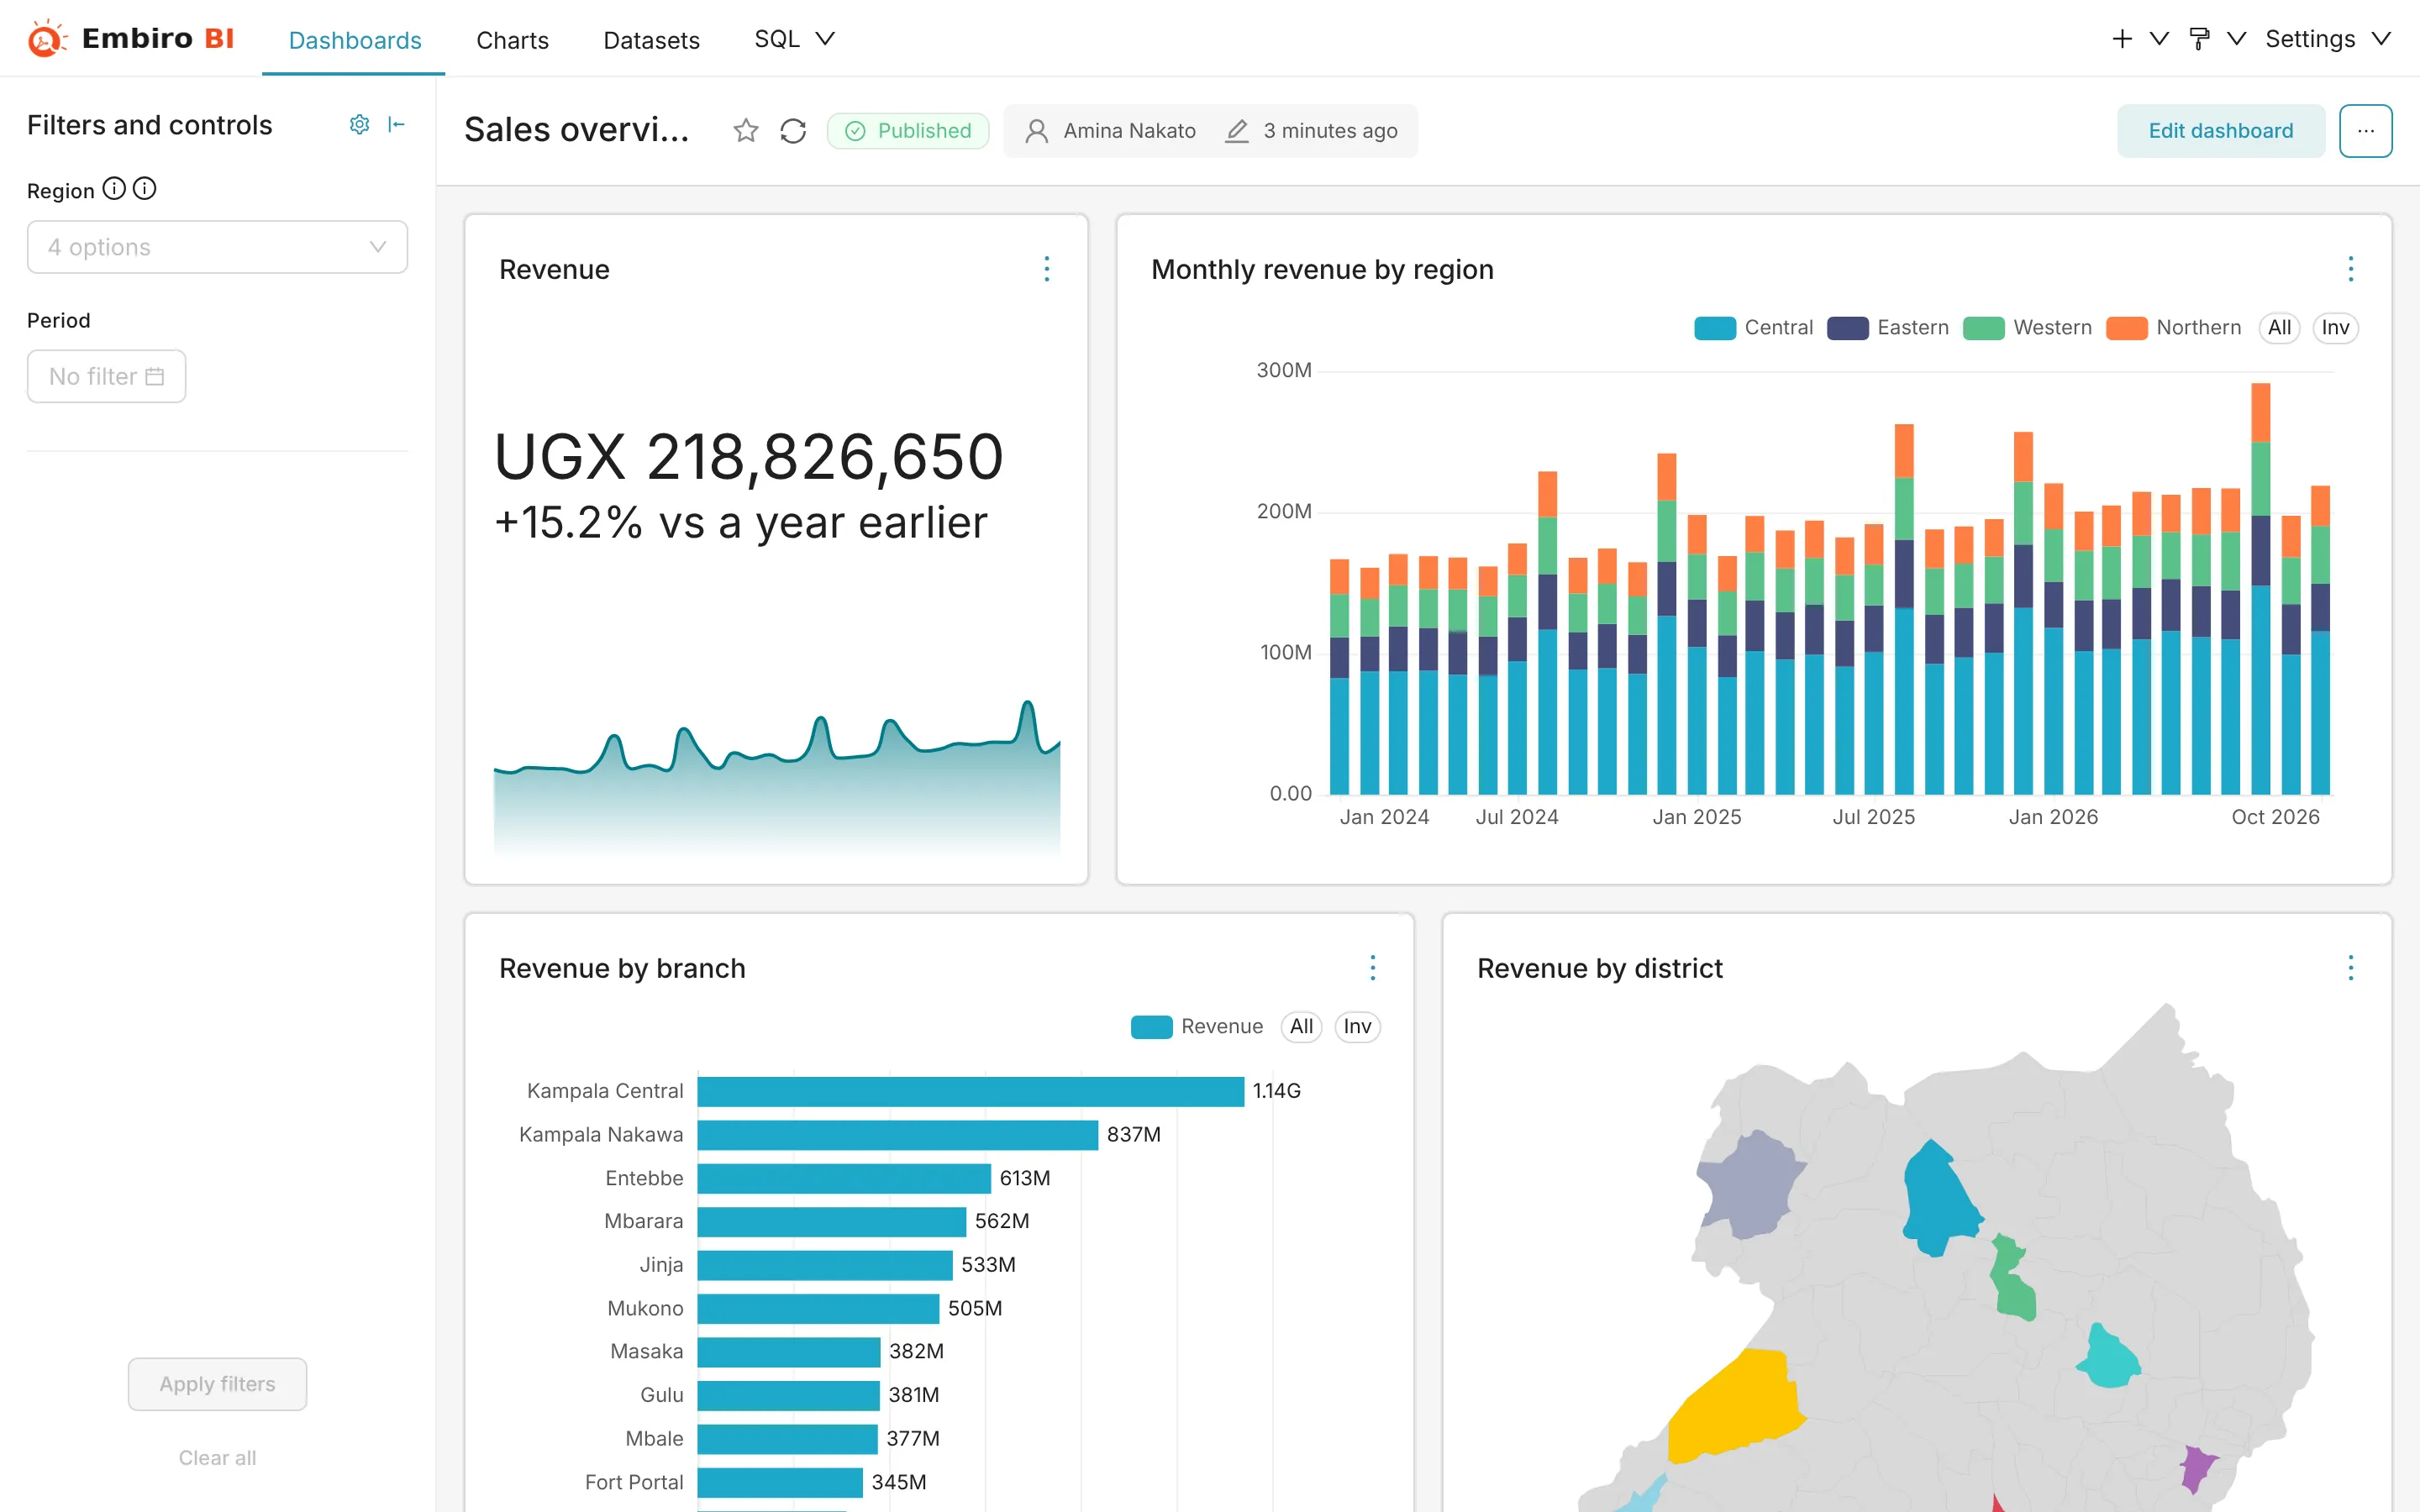
Dashboard properties
⋯ → Edit properties sets:
- Name and URL slug, for a readable link ending in
/sales/instead of a number; - Owners, who can always edit it;
- Certified by and Certification details, for a "certified" badge;
- Tags, see Tags;
- Colors: a colour scheme for the whole dashboard;
- Advanced: the dashboard's JSON metadata (refresh frequency, label colours, and so on).
Who can see a dashboard
Super Admins, Admins and Analysts see every dashboard in the organization. A Business User sees a published dashboard when their groups have access to the datasets its charts use. A group can also be limited to specific dashboards or charts.
Version history and restoring
Deleted a dashboard or chart by mistake? Ask your Super Admin or Admin to restore it soon: deleted dashboards and charts can be restored from the trash for a limited time.
Related
Something unclear or missing? Tell us and we'll improve this page.