
Documentation › Team and access
Groups and data access
Use groups to decide which datasets, dashboards and charts each Business User sees, and to limit rows with row-level security.
Groups decide what Business Users see. A group such as Regional managers or Finance is given access to datasets. Its members then see the published dashboards and charts built on those datasets, and nothing else.
Super Admins, Admins and Analysts see everything in the organization, so groups don't limit them.
Who can do this: Super Admin and Admins.
Create a group
- Open Settings → Groups.
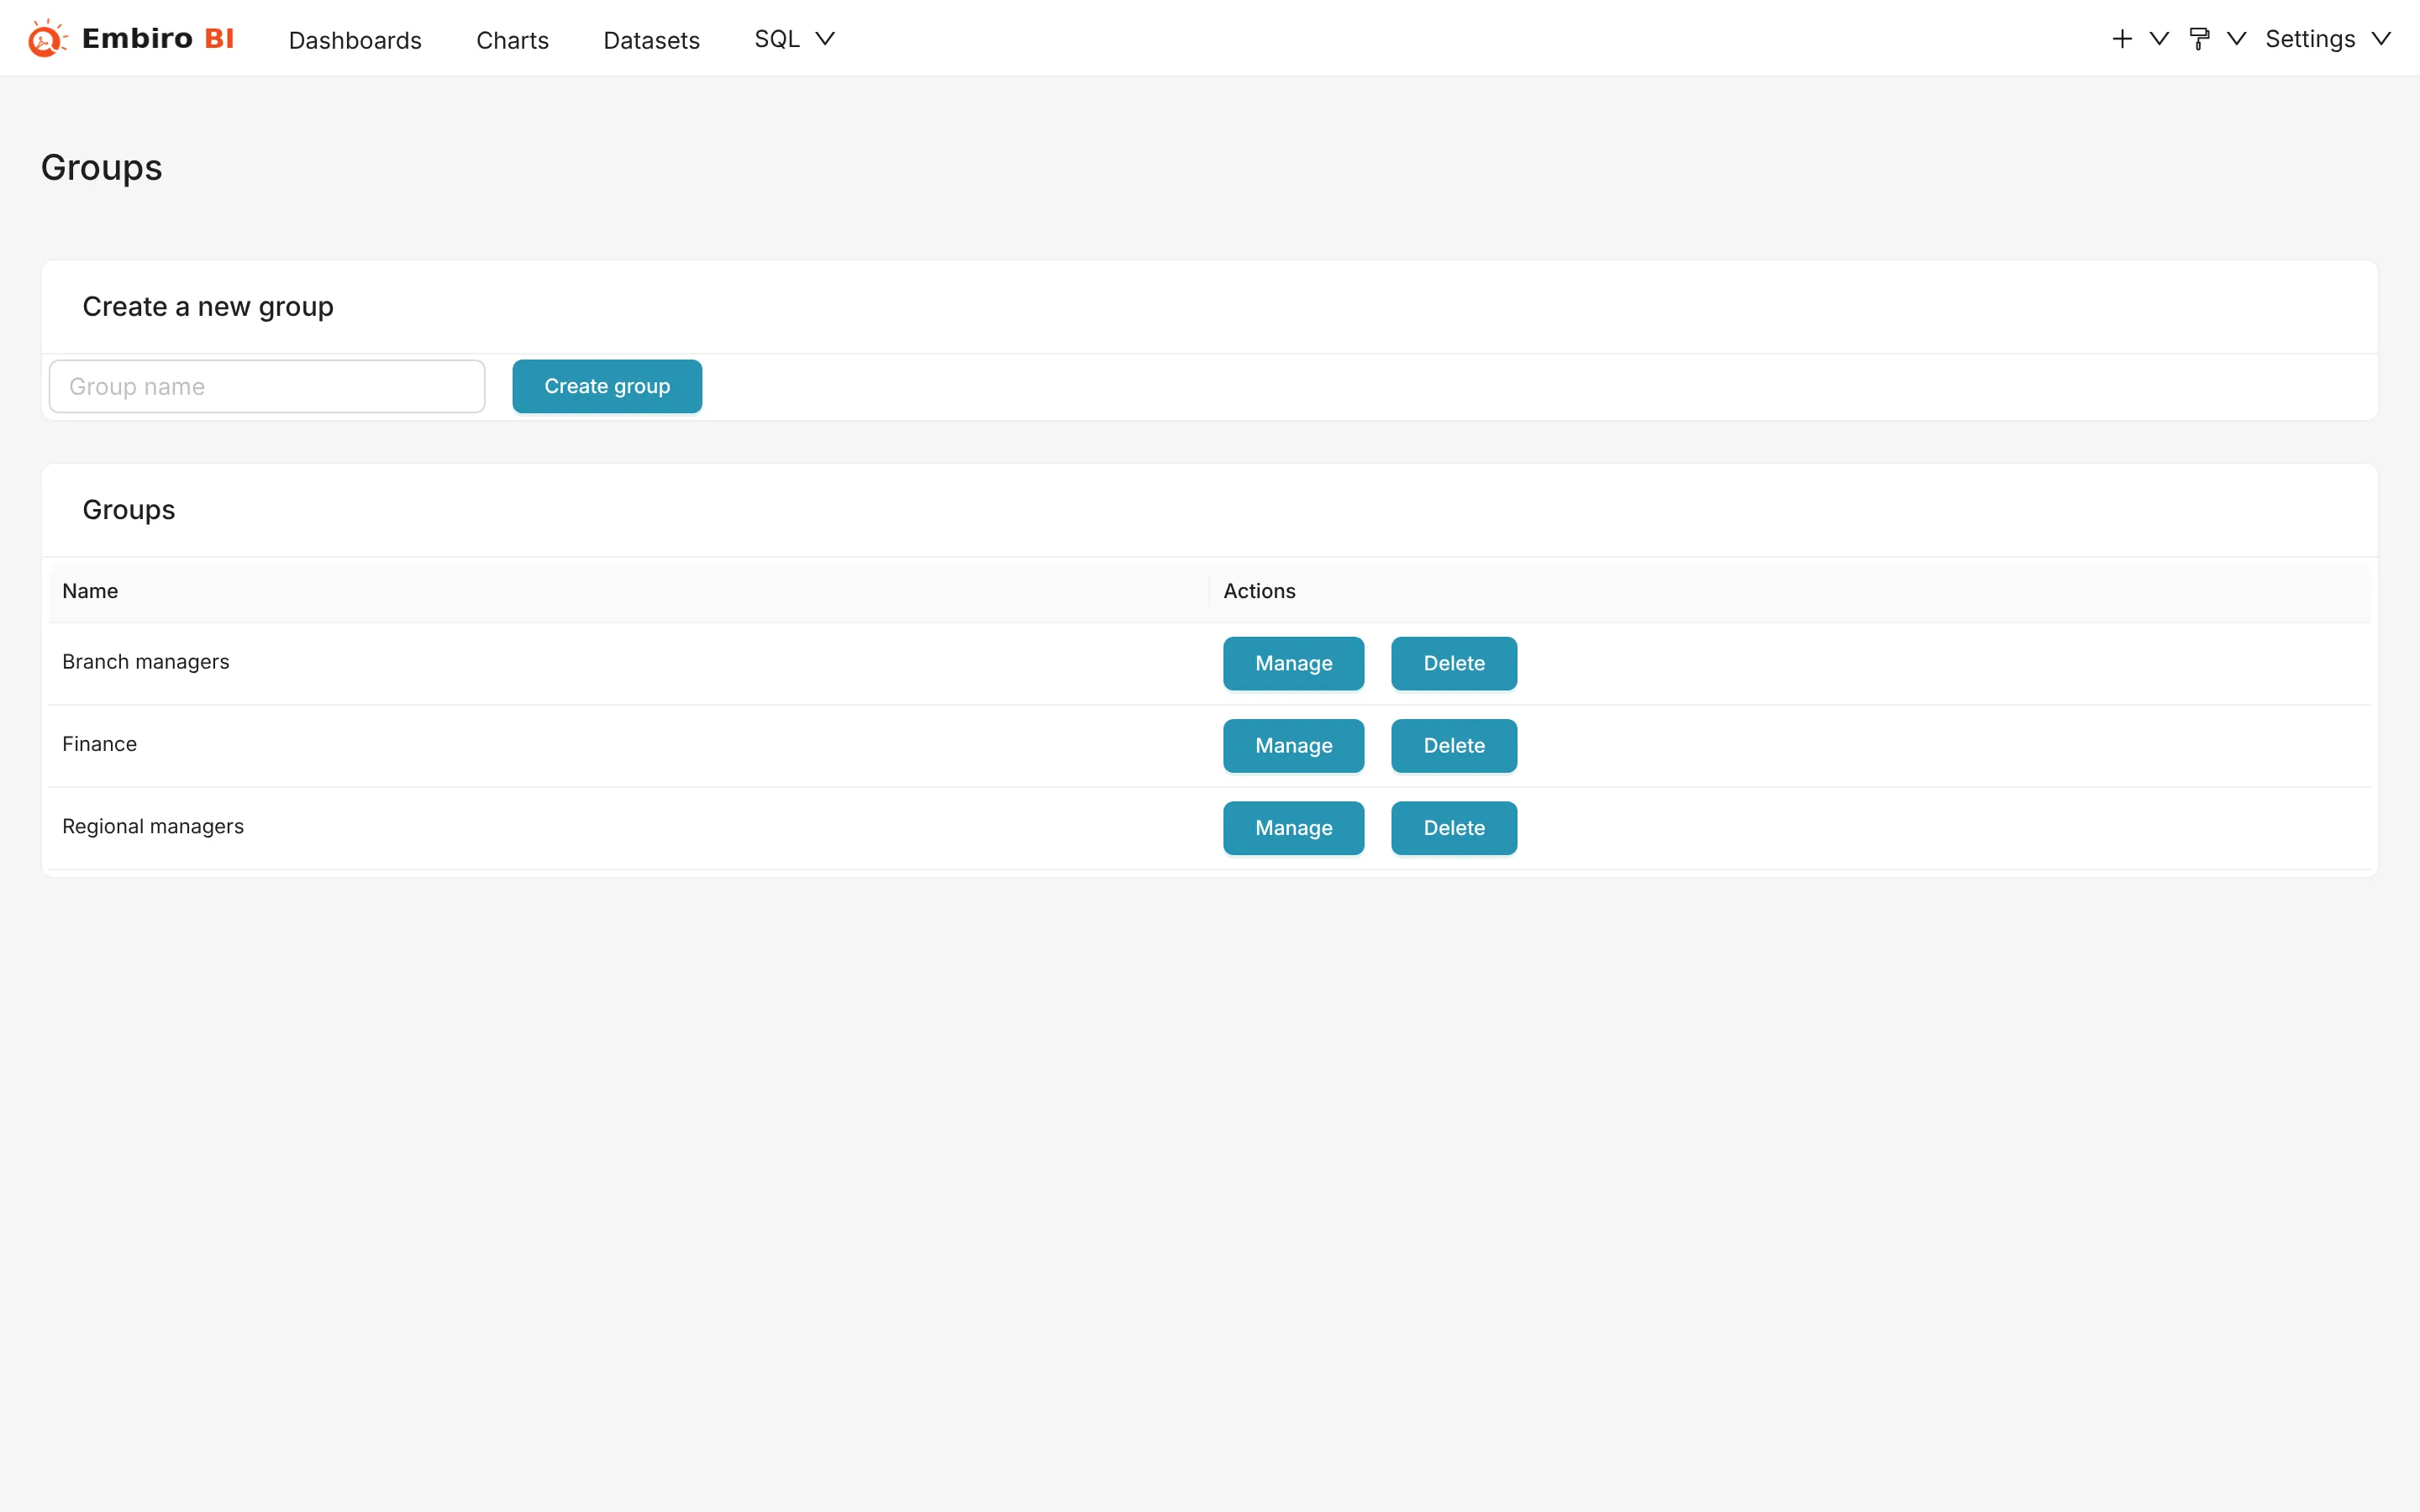
- Under Create a new group, type a Group name, such as Sales team, and click Create group.
- Open the group to set it up.
Set what a group sees
In a group:
- Members
- Tick the members who belong to it. A member can be in several groups: they see everything any of their groups allows.
- Datasets
- Tick the datasets the group may use. Its members see every published dashboard and chart built only on those datasets.
- Dashboards
- Optionally limit the group to specific dashboards, when a dataset is used on more dashboards than they should see.
- Charts
- Optionally limit the group to specific charts in the same way.
Changes apply on the member's next page load.
Example: branch managers see only the sales dashboard
- Create the group Branch managers.
- Tick the dataset Sales.
- Under Dashboards, tick Sales overview, so they don't also see the Finance dashboard that uses the same dataset.
- Tick the branch managers as members.
Limit rows: each person sees their own region
Groups decide which datasets someone sees. To decide which rows they see, such as only their own region's sales, there are two approaches:
- One group per region with a row filter
- Create a group per region (Central, Eastern, ...) and ask us to add a row-level filter to each group, such as
region = 'Central'. Every chart its members open is filtered to that region. - Filter by the person in the dataset
-
Keep a table in your database that maps users to what they may see, and filter the dataset with the signed-in person's email:
sql
SELECT s.*
FROM sales s
JOIN sales_access a ON a.region = s.region
WHERE a.email = '{{ current_user_email() }}'
Save it as a virtual dataset and build the charts on it.
When someone can't see a dashboard
Check, in this order:
- The dashboard is Published, not Draft.
- The person is a member of a group that has every dataset the dashboard's charts use.
- If the group lists specific Dashboards or Charts, the dashboard and its charts are ticked.
- The person has reloaded the page since the change.
Something unclear or missing? Tell us and we'll improve this page.