
Documentation › SQL Lab
Parameters and date ranges
Add parameters to SQL Lab queries - text, numbers, dates, dropdowns and date ranges - and turn them into chart filters on dashboards.
Parameters turn a query into a small form. Write {{ name }} in your SQL and SQL Lab shows an input for it above the editor. Change the value and run again, without editing the SQL. Saved as a dataset, the same parameters become filters on every chart built on it.
Your first parameter
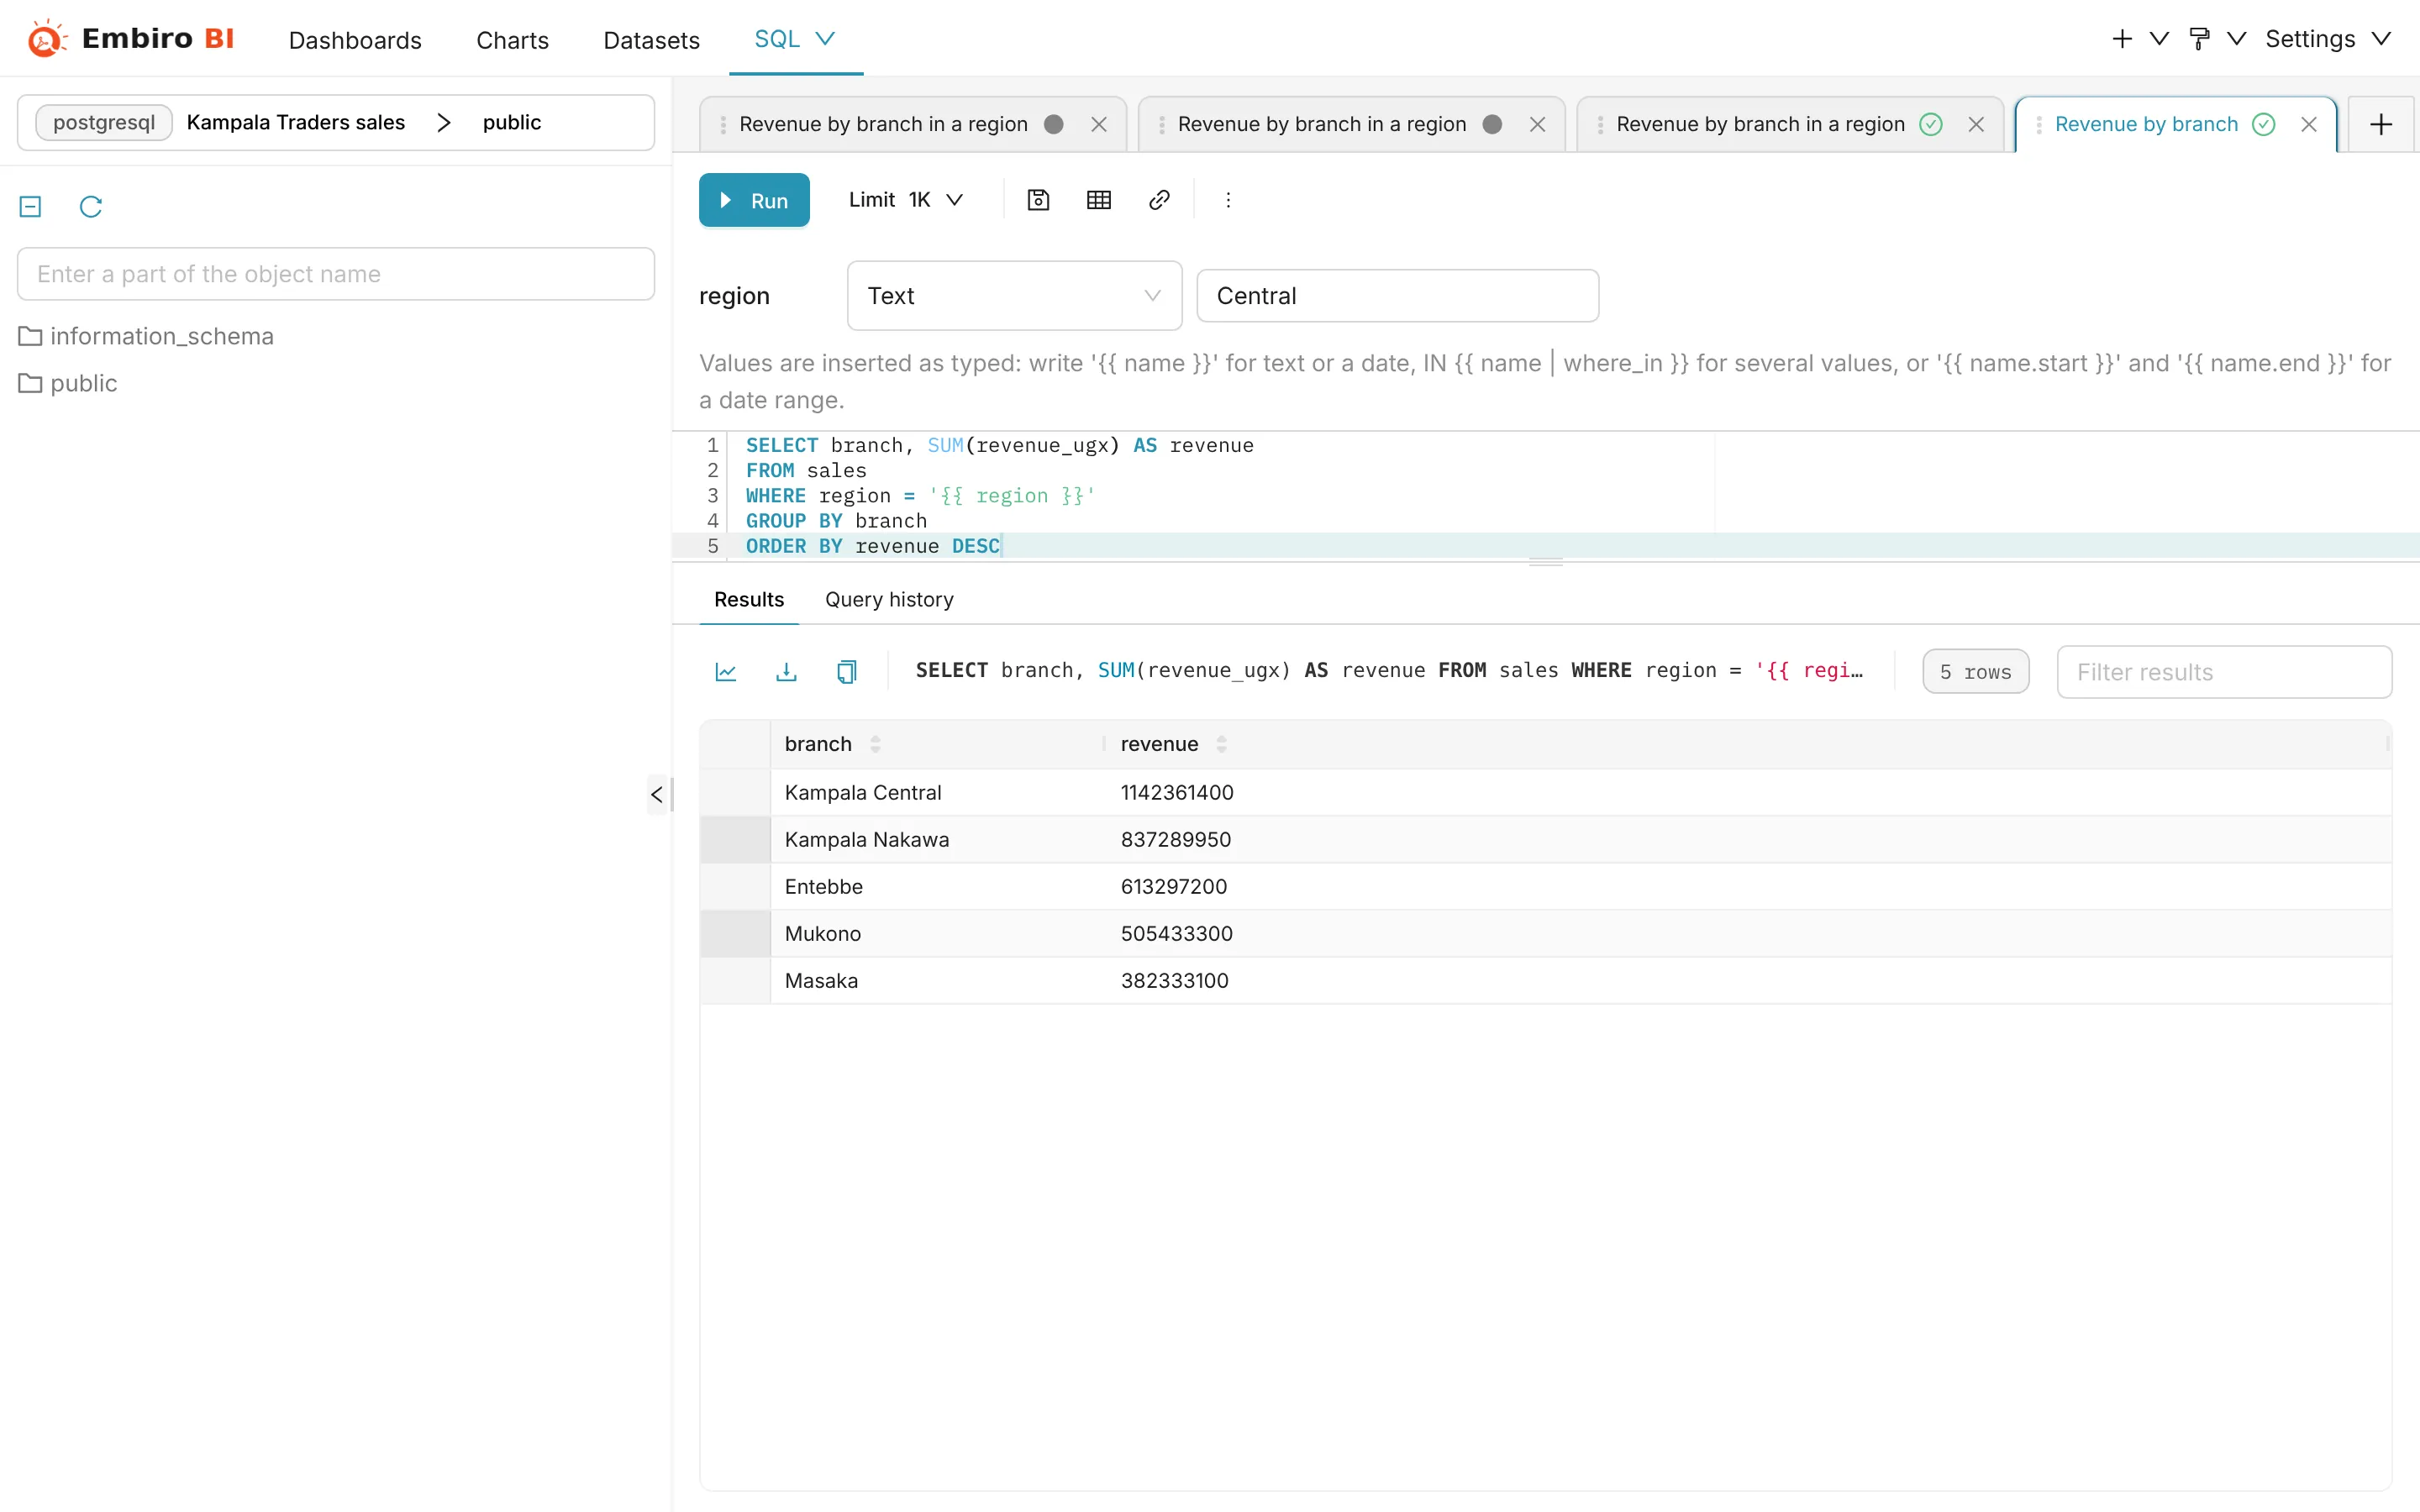
SELECT branch, SUM(revenue_ugx) AS revenue
FROM sales
WHERE region = '{{ region }}'
GROUP BY branch
When you type {{ region }}, an input called region appears above the editor. Enter Central and click Run. The values are saved with the query.
Quote text and dates yourself
A parameter's value is inserted exactly as typed. Put quotes around text and dates in the SQL: WHERE region = '{{ region }}' and WHERE order_date >= '{{ start_date }}'. Numbers need no quotes: WHERE quantity > {{ min_qty }}.
Parameter types
Click Type of region next to an input to choose its type:
| Type | Input | Example SQL |
|---|---|---|
| Text | A text box | WHERE region = '{{ region }}' |
| Number | A number box (checked to be a number) | WHERE quantity > {{ min_qty }} |
| Date | A date picker | WHERE order_date >= '{{ start_date }}' |
| Date and time | A date and time picker | WHERE created_at < '{{ cutoff }}' |
| Dropdown | A list of values you type | WHERE payment_method = '{{ method }}' |
| Dropdown from a dataset | Values from a dataset's column | WHERE branch = '{{ branch }}' |
| Date range | Fixed dates or a preset such as Last 12 months | See date ranges |
Dropdown from a dataset takes its choices from the distinct values of a column in a dataset you choose, such as the branch column of the Sales dataset. It respects data access: people only see values they're allowed to see. For a custom list, save a query such as SELECT DISTINCT branch FROM branches as a virtual dataset and use that.
Several values: where_in
To let people pick several values, use the where_in filter. It quotes and escapes each value and adds the brackets:
SELECT *
FROM sales
WHERE branch IN {{ branch | where_in }}
The input then takes a list: a multi-select dropdown, or comma-separated values in a text box. Kampala Road, Ntinda becomes ('Kampala Road', 'Ntinda').
Date ranges
Use .start and .end on a parameter to make it a date range:
SELECT DATE_TRUNC('month', order_date) AS month, SUM(revenue_ugx) AS revenue
FROM sales
WHERE order_date BETWEEN '{{ period.start }}' AND '{{ period.end }}'
GROUP BY 1
ORDER BY 1
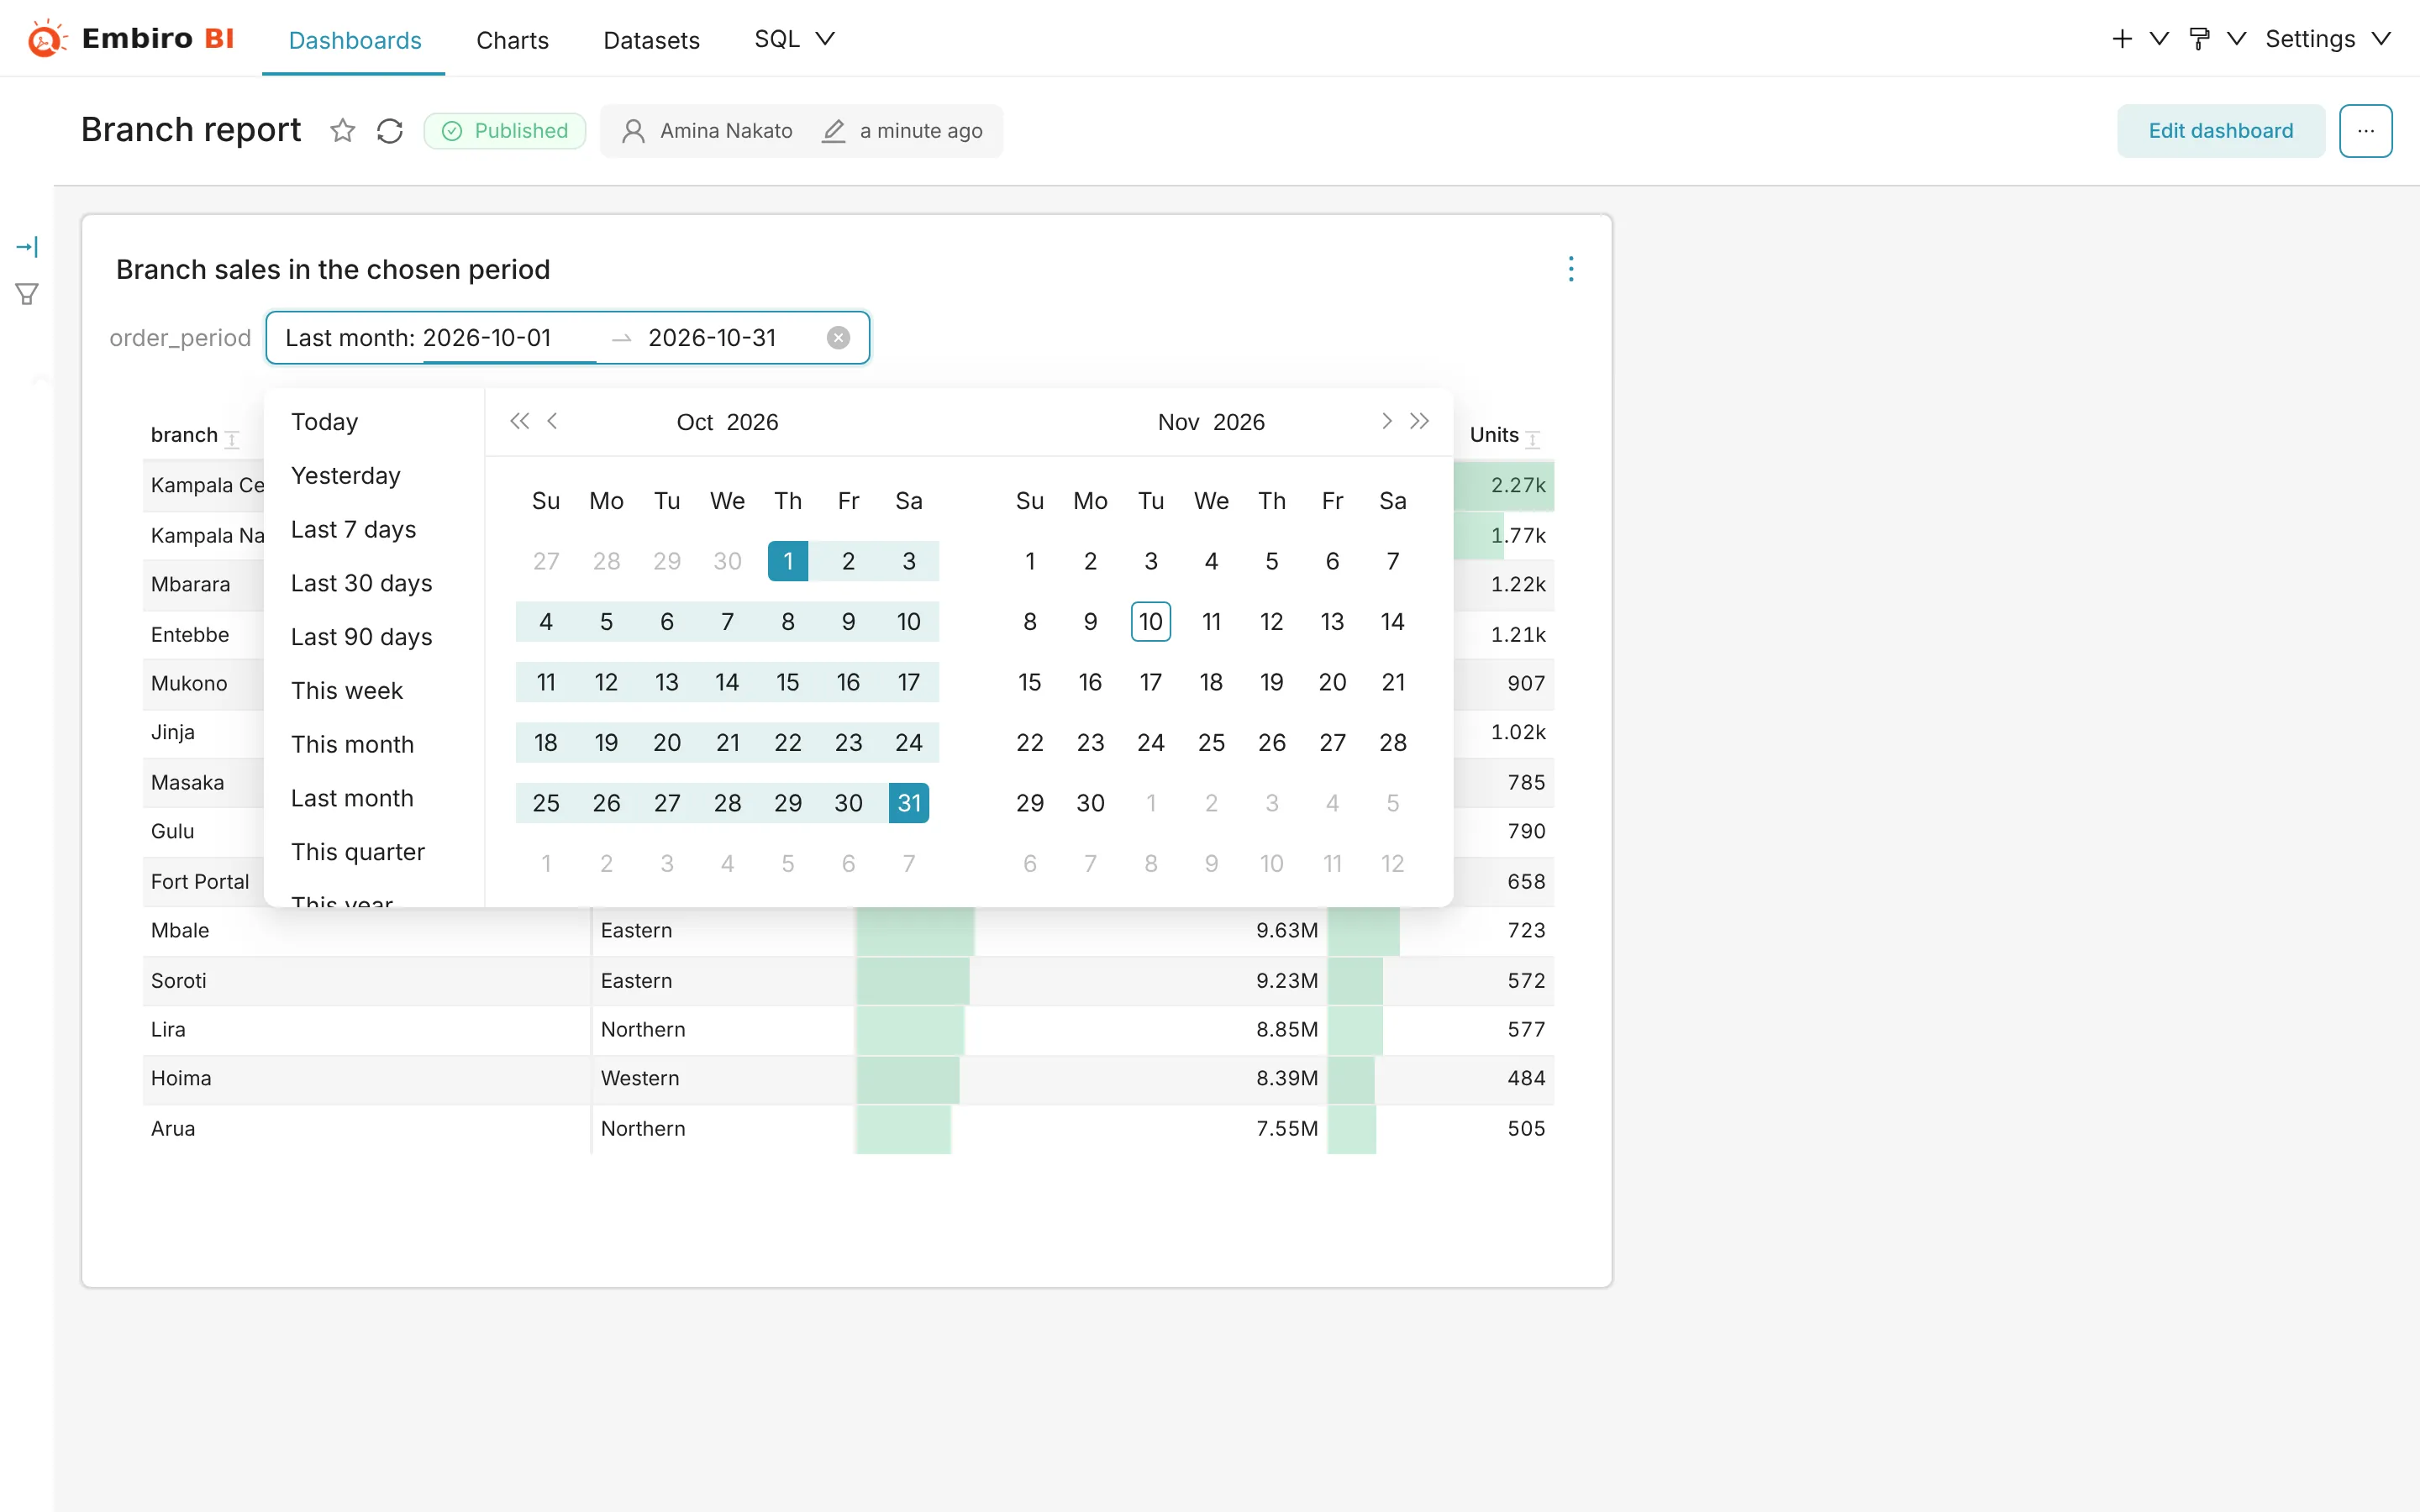
The period input offers fixed dates or a preset: Today, Yesterday, Last 7 days, Last 30 days, Last 90 days, This week, This month, Last month, This quarter, This year, Last year or Last 12 months. A preset is worked out when the query runs, so a saved query with Last 12 months always shows the latest 12 months.
period.start and period.end are dates (2026-03-01), and both days are included: Last month in April gives 2026-03-01 and 2026-03-31. For a timestamp column, compare against the day after the end so the last day is complete:
WHERE created_at >= '{{ period.start }}'
  AND created_at <  DATE '{{ period.end }}' + INTERVAL '1 day'
Example: filter a chart by due date
A common need is a filter on a date that isn't the chart's main date, such as an invoice's due date, while the chart's own time range stays on the invoice date. A date-range parameter does this.
1. Write the query in SQL Lab
SELECT invoice_id, customer, amount_ugx, invoice_date, due_date, status
FROM invoices
WHERE due_date BETWEEN '{{ due_date.start }}' AND '{{ due_date.end }}'
Adding .start and .end to the same name makes due_date a date range. An input called due_date appears above the editor.
2. Set the type and a default
Next to due_date, check the type is Date range. Pick a preset such as This month or Last 30 days, or two fixed dates, and click Run. The value you leave here becomes the default that charts start with. A preset is worked out each time the query runs, so This month always means the current month.
3. Save it as a dataset
Save → Save dataset → Save as new, named for example Invoices by due date. The dataset keeps the parameter and its type.
4. Build the chart and put it on a dashboard
Create a chart on the dataset, for example a Table of overdue amounts by customer, and add it to a dashboard.
5. Use it on the dashboard
The chart's card shows due_date with a date picker: viewers choose a preset or two dates and click Apply Changes. Only that chart changes. Each viewer's choice is remembered in their browser, and Reset goes back to the dataset's default.
Parameter names have no spaces
A parameter name is one word: letters, digits and underscores, starting with a letter. Write {{ due_date.start }}, not {{ Due date.start }}: a name with a space isn't recognized as a parameter and the query fails. The name is also the filter's label on the chart, so choose a readable one such as due_date, payment_date or period.
More date-range patterns:
| You want | SQL |
|---|---|
| A date column, both days included | WHERE due_date BETWEEN '{{ due_date.start }}' AND '{{ due_date.end }}' |
| A timestamp column, the whole last day included | WHERE paid_at >= '{{ paid.start }}' AND paid_at < DATE '{{ paid.end }}' + INTERVAL '1 day' |
| Two different date filters on one chart | WHERE invoice_date BETWEEN '{{ issued.start }}' AND '{{ issued.end }}' AND due_date BETWEEN '{{ due.start }}' AND '{{ due.end }}' |
| Overdue as of the end of the period | WHERE due_date < '{{ due_date.end }}' AND status <> 'Paid' |
Chart filters on dashboards
Save a parameterized query as a dataset (Save → Save dataset). It keeps its parameters and their types. Every chart built on that dataset then shows the parameters as filters inside the chart's card on dashboards:
- viewers change the values and click Apply Changes, which shows how many filters changed, so the chart doesn't re-run on every pick;
- the values apply to that chart only and are remembered in the viewer's browser;
- Reset restores the dataset's saved values.
Embiro BI checks every value a viewer sends: only the dataset's declared parameters are accepted, numbers and dates must be valid, text is escaped, and lists are only allowed for parameters used with where_in.
Other template functions
SQL Lab, datasets and charts also understand these Jinja functions:
| Function | What it gives |
|---|---|
{{ current_username() }} |
The signed-in person's username, for example to filter to their own rows |
{{ current_user_email() }} |
Their email address |
{{ url_param('branch') }} |
A value from the dashboard's address, such as ?branch=Ntinda |
{{ filter_values('region') }} |
The values chosen in a dashboard filter on region, as a list |
{{ from_dttm }}, {{ to_dttm }} |
The chart's time range start and end |
Always quote url_param
Anyone can change a dashboard's address, so always put url_param() inside quotes: WHERE id = '{{ url_param("id") }}', never WHERE id = {{ url_param("id") }}.
Something unclear or missing? Tell us and we'll improve this page.