
Documentation › Dashboards
Dashboard filters
Add filters to a dashboard - values, time ranges, numbers - plus cross-filtering, drill-down and per-chart parameter filters.
Dashboard filters let viewers narrow every chart at once: pick a region, a branch or a period, and the charts follow.
Add a filter
Who can do this: Super Admin, Admin and Analysts (anyone who can edit the dashboard).
- Open the dashboard. The filter bar is on the left. If it is collapsed, click the arrow.
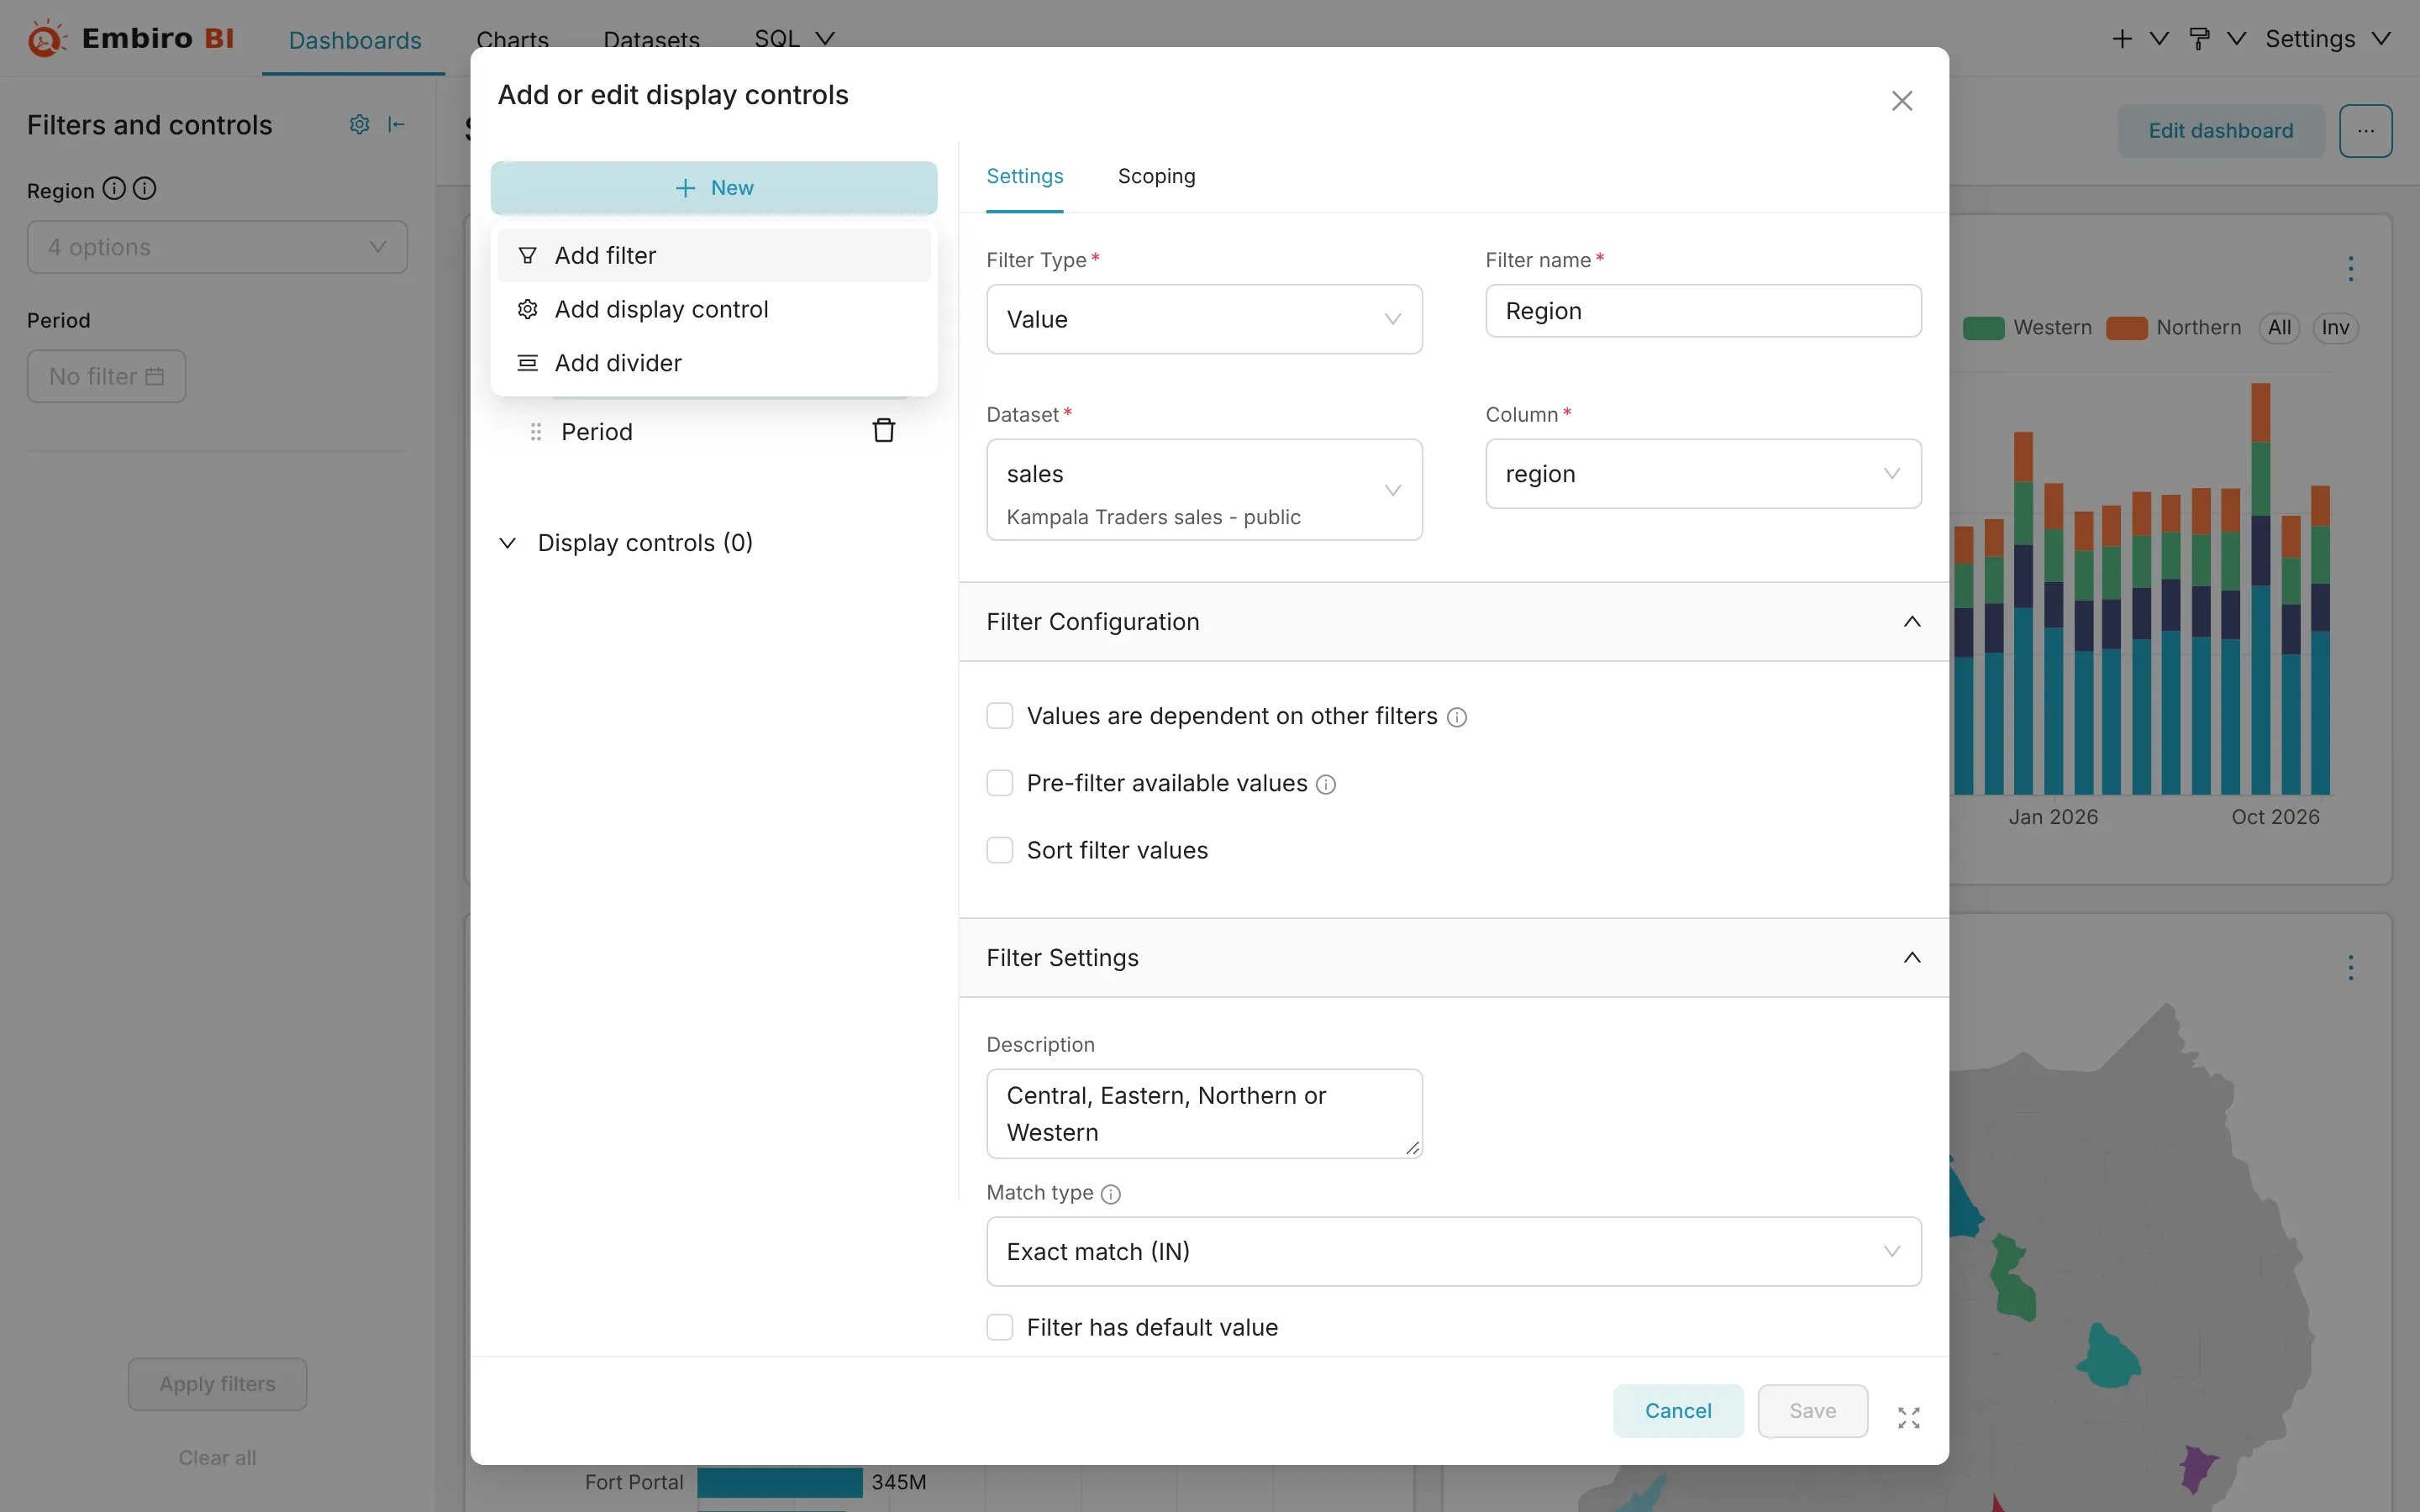
- Click the gear icon at the top of the filter bar → Add or edit filters and controls. The Add or edit display controls window opens.
- Click + New → Add filter.
-
Choose the Filter type:
Type Use it for Value Picking from a column's values: region, branch, product, sales agent Time range Choosing a period: Last month, a custom range Time column Letting viewers switch which date column the time range applies to Time grain Switching charts between day, week, month and year Numerical range A slider for a number column: order value, age -
Give it a Filter name viewers will understand, such as Region.
- Choose the Dataset and Column.
- Set the options you need (see below), then click Save.
Useful options
- Filter has default value: applied when the dashboard opens, such as Current year.
- Can select multiple values: on by default for Value filters.
- Filter value is required: viewers can't clear it.
- Select first filter value by default.
- Sort filter values: alphabetical, or by a metric.
- Values are dependent on other filters (under Advanced): the Branch list then only shows branches in the chosen Region.
- Scoping (the second tab): which charts the filter applies to. By default it is every chart whose dataset has the column. Charts on other datasets are left alone.
Dividers
+ New → Add divider adds a heading with a short description between groups of filters, such as Location and Period.
Using filters as a viewer
- Choose values in the filter bar.
- Click Apply filters. Charts update together.
- Clear all resets the filters to their defaults.
Choosing Central in the Region filter and clicking Apply filters: every chart follows.
The chosen filters are part of the address: share the URL and colleagues see the same selection.
Cross-filtering
Click a bar, a pie slice, a table row or a map area to filter the other charts on the dashboard by that value. The filter appears at the top of the filter bar under Cross-filters. Click it again, or × in the bar, to remove it.
Drill to detail and drill by
Right-click a data point:
- Drill to detail shows the underlying rows behind that bar or slice, in a table you can page through;
- Drill by regroups the chart by another column, for example from region to district within the region you clicked.
Chart filters from dataset parameters
Charts built on a dataset saved from SQL Lab with parameters (such as {{ region }} or a date range {{ period }}) show those parameters as filters inside the chart's card. They apply to that chart only:
- change the values, then click Apply Changes (it shows how many filters changed);
- your choices are remembered in your browser for that chart, and Reset restores the dataset's defaults.
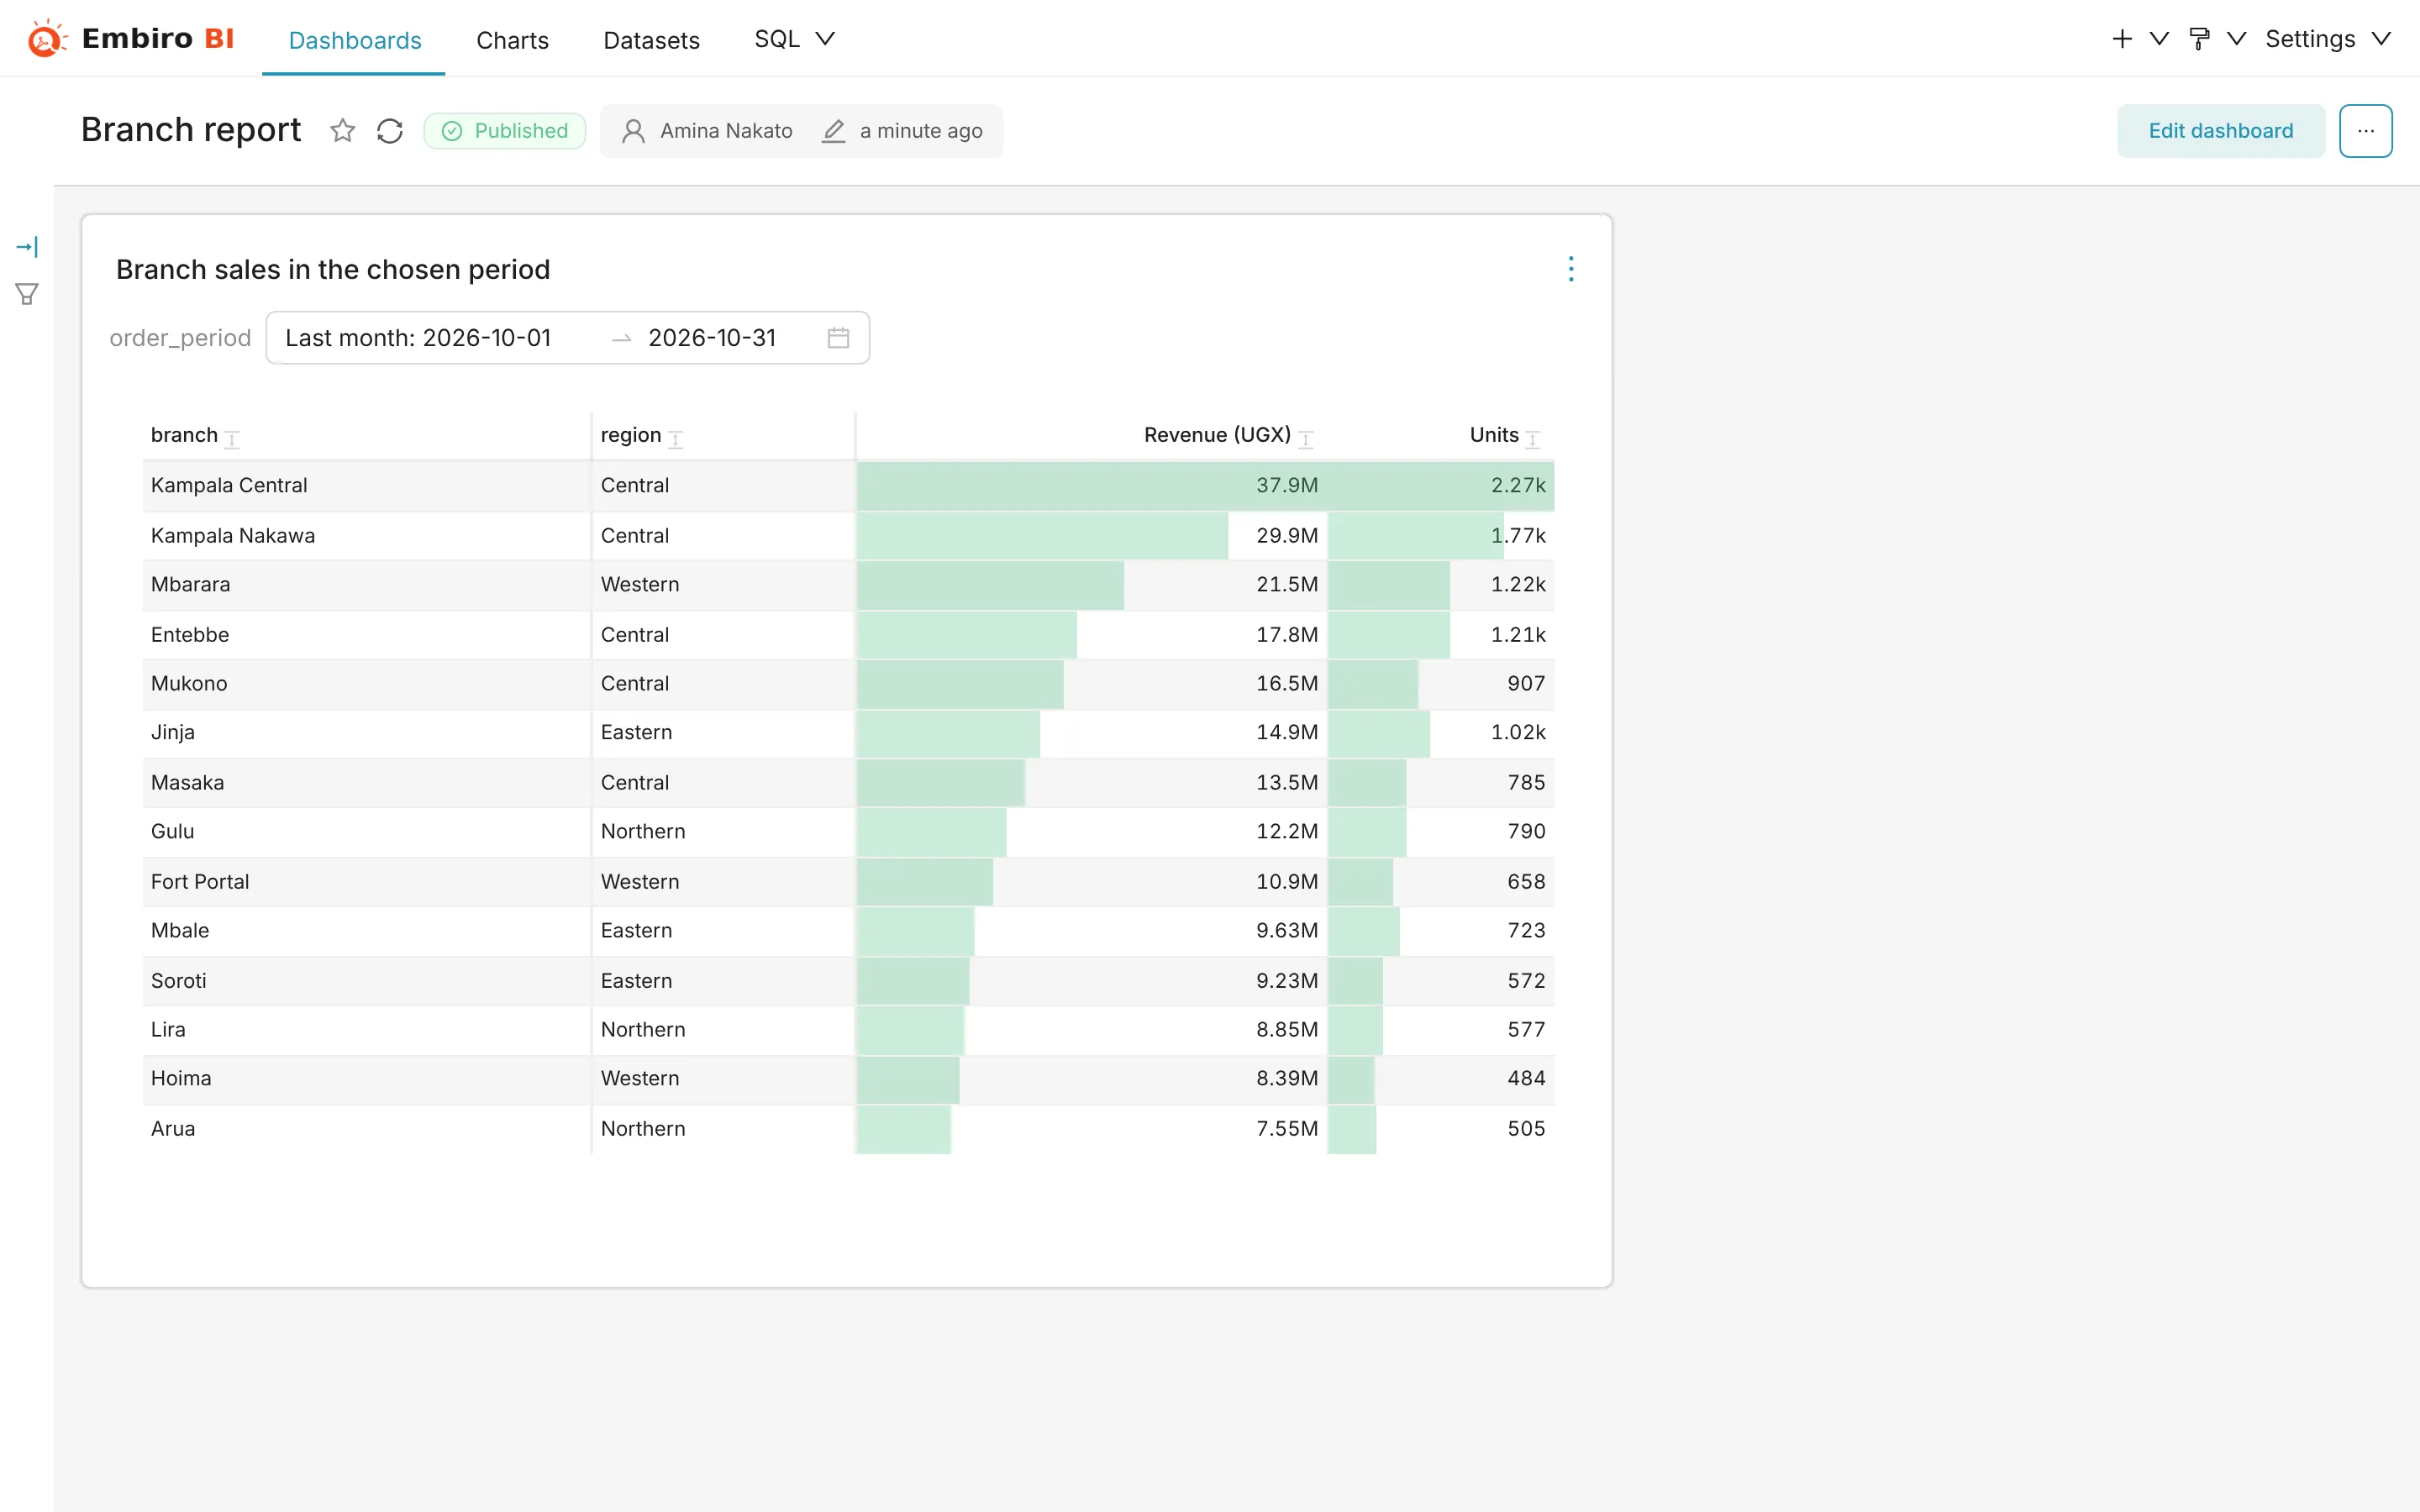
For a step-by-step example with a date range such as {{ due_date.start }} and {{ due_date.end }}, see Filter a chart by due date.
Something unclear or missing? Tell us and we'll improve this page.