
Documentation › Getting started
Quick start: your first dashboard
Build your first Embiro BI dashboard in about ten minutes, from connecting data to sharing the link.
This walk-through takes you from an empty organization to a dashboard you can share. It uses a sales table as the example. Use any table you have: a database table, a Google Sheet or an uploaded Excel file all work the same way.
You need the Super Admin, Admin or Analyst role. Business Users read dashboards but don't build them.
1. Connect your data
- On Home, click Connect data. You can also use + (top right) → Data → Connect database.
- Choose your database type, for example PostgreSQL, and fill in the host, port, database name, username and password.
- Click Connect.
Your data is in a Google Sheet or a file? Follow Google Sheets or Uploading CSV and Excel files instead, then come back to step 2.
Database behind a firewall?
Allow Embiro BI's address 13.49.213.196 on your database port, or connect through an SSH jump host. See Firewalls and SSH tunnels.
2. Create a dataset
A dataset tells Embiro BI which table to chart.
- Open Datasets in the top menu and click + Dataset.
- Pick the Database, the Schema (for PostgreSQL usually
public) and the Table, for examplesales. - Click Create dataset and create chart.
3. Build a chart
- Choose a chart type. For a first chart, pick Bar Chart and click Create new chart.
- In the chart editor (called Explore):
- drag a date column, such as
order_date, into X-axis; - in Metrics, click +, choose the column
revenue_ugxand the aggregateSUM, then Save; - in Time grain, choose Month.
- drag a date column, such as
- Click Create chart (or Update chart) to draw it.
- Click Save, give it a name such as Monthly revenue, and under Add to dashboard type a new dashboard name such as Sales overview.
- Click Save & go to dashboard.
4. Arrange the dashboard
- On the dashboard, click Edit dashboard.
- Drag more charts from the right-hand panel, resize them by dragging their edges, and add Header, Text or Tabs elements from the Layout elements tab.
- Click Save.
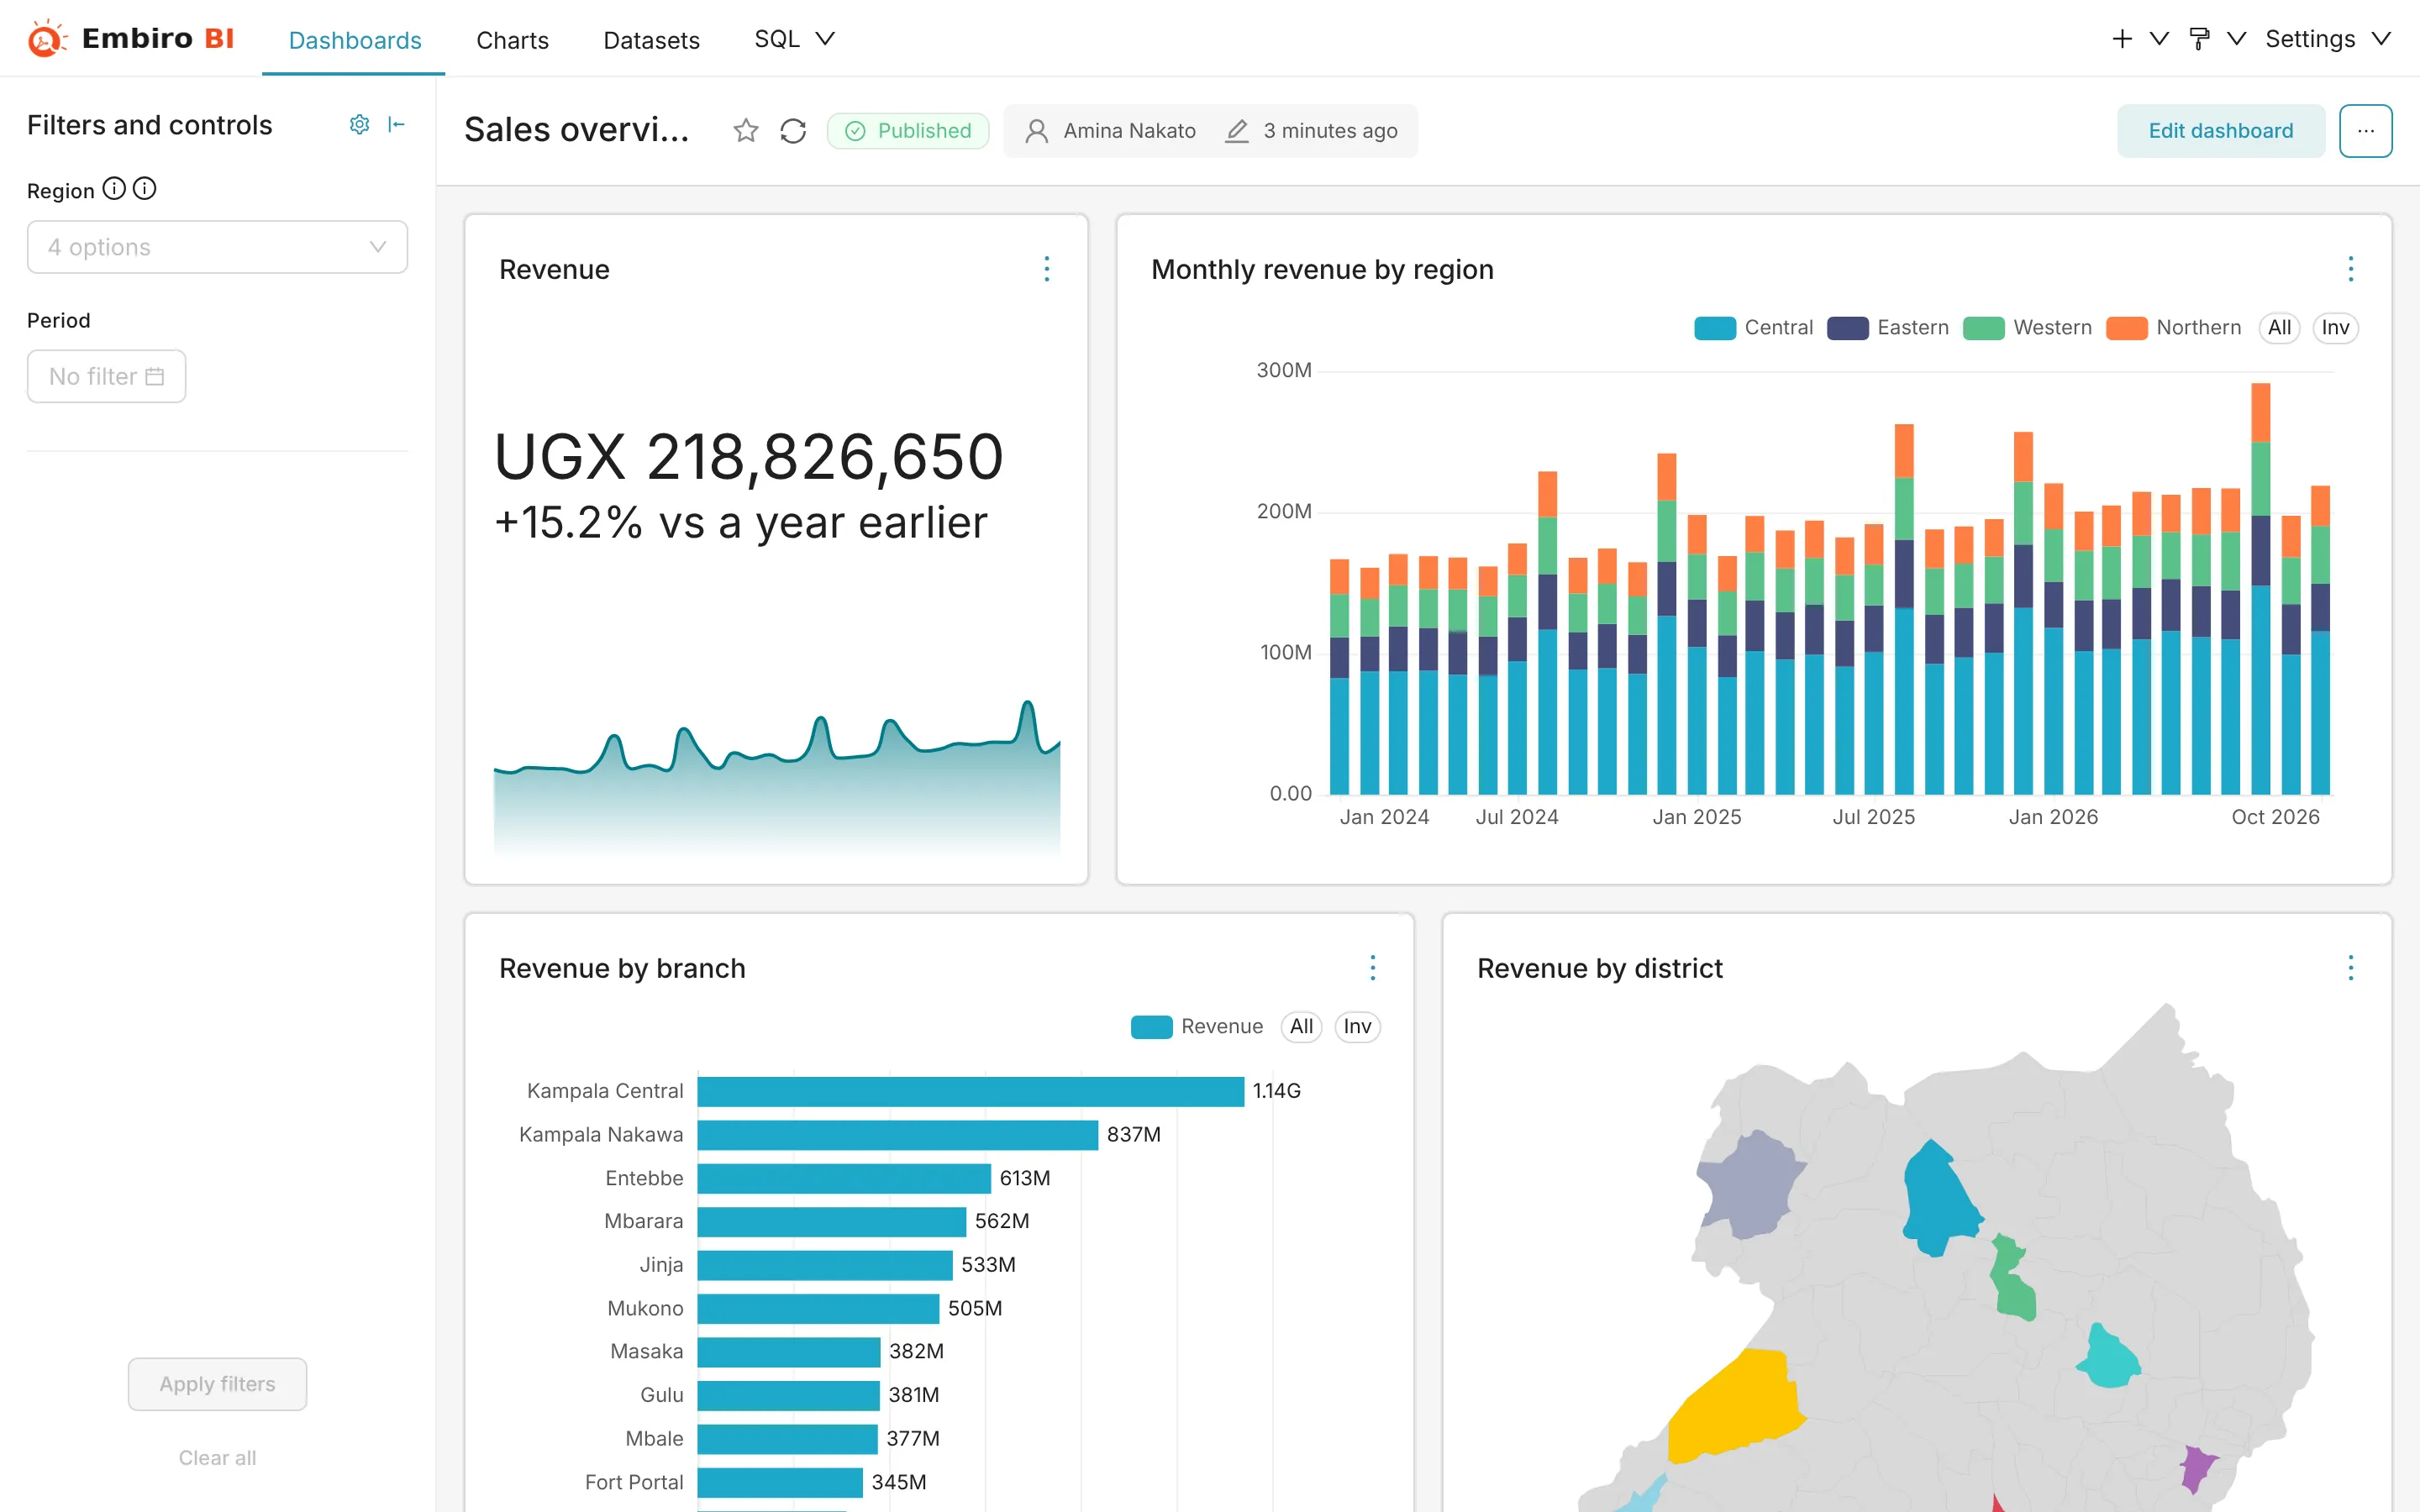
5. Add a filter
- Click the filter icon on the left of the dashboard → + Add or edit filters.
- Choose Value as the filter type, the dataset, and a column such as
region. - Click Save. Viewers can now pick a region and every chart on that dataset follows.
More on dashboard filters.
6. Share it
- Click Draft next to the title to switch it to Published, so it appears in everyone's dashboard list.
- Click Share → Copy permalink to clipboard and send the link. People need an account in your organization and access to the dashboard's data to open it. See Groups and data access.
- To get it by email every Monday, see Alerts and reports.
Something unclear or missing? Tell us and we'll improve this page.